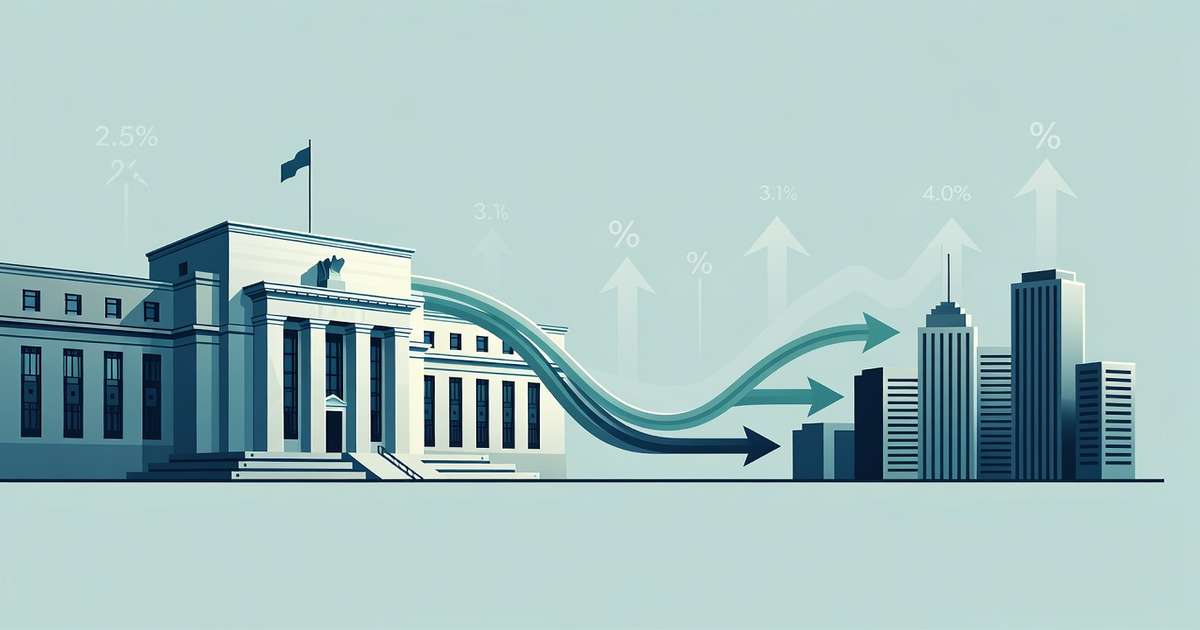
The Consumer Price Index for All Urban Consumers increased 0.5 percent in May on a seasonally adjusted basis and 4.2 percent over the past 12 months, the Bureau of Labor Statistics reported on June 10. It is the first annual inflation reading above 4 percent since April 2023, and it landed less than a week before the Federal Reserve’s June 16-17 policy meeting, the first with Kevin Warsh in the chair. Energy did most of the damage: gasoline jumped 7.0 percent in May alone and has climbed 40.5 percent over the year as the Iran conflict keeps crude prices elevated.
The number beneath the headline tells a calmer story. Core CPI, which strips out food and energy, rose just 0.2 percent for the month and 2.9 percent over the year. That split between a hot headline and a contained core frames the central question for the Fed next week: does an oil-driven price spike demand a response, or can policymakers look through it? Fed funds futures still point firmly to a hold, according to CNBC reporting on CME FedWatch data, though traders increasingly expect the next move to be an increase rather than a cut. You can follow every reading on our U.S. inflation tracker and check where the current prime rate stands today.
Key Takeaways
- Headline CPI rose 0.5% in May and 4.2% over 12 months, the first annual reading above 4% since April 2023.
- Core CPI rose just 0.2% for the month and 2.9% over the year, far calmer than the headline.
- Energy drove over 60% of the monthly increase; gasoline rose 7.0% in May and 40.5% over the year.
- The Fed meets June 16-17; futures markets still price a hold, with hike odds building for late 2026.
- The prime rate sits at 6.75%, so variable card APRs and HELOCs are unchanged for now.
Table of Contents
What the May CPI Shows
The BLS release shows monthly inflation cooling slightly even as the annual rate accelerates. All-items CPI rose 0.9 percent in March, 0.6 percent in April, and 0.5 percent in May on a seasonally adjusted basis. Because those three prints replaced much smaller readings from a year earlier, the 12-month rate climbed from 3.3 percent in March to 3.8 percent in April and 4.2 percent in May. The unadjusted index now stands at 335.123 on the 1982-84 base. Shelter rose 0.3 percent for the month, with owners’ equivalent rent up 0.3 percent and rent up 0.4 percent. Food increased 0.2 percent, as grocery prices edged up 0.1 percent and food away from home rose 0.3 percent; the food index is up 3.1 percent over the year.
Core inflation behaved very differently. The all-items-less-food-and-energy index rose 0.2 percent in May after a 0.4 percent April increase, and its 12-month rate ticked up from 2.8 percent to 2.9 percent. The monthly gainers were scattered and mostly modest: communication rose 1.3 percent, airline fares 2.7 percent, personal care 1.0 percent, and recreation 0.3 percent. Several large categories fell outright. Motor vehicle insurance declined 1.7 percent, household furnishings and operations fell 0.6 percent, and new vehicle prices slipped 0.3 percent. Shelter, the heaviest component in the index, is running 3.4 percent higher than a year ago, continuing its slow descent from the 2023 peaks.
Energy Did the Damage
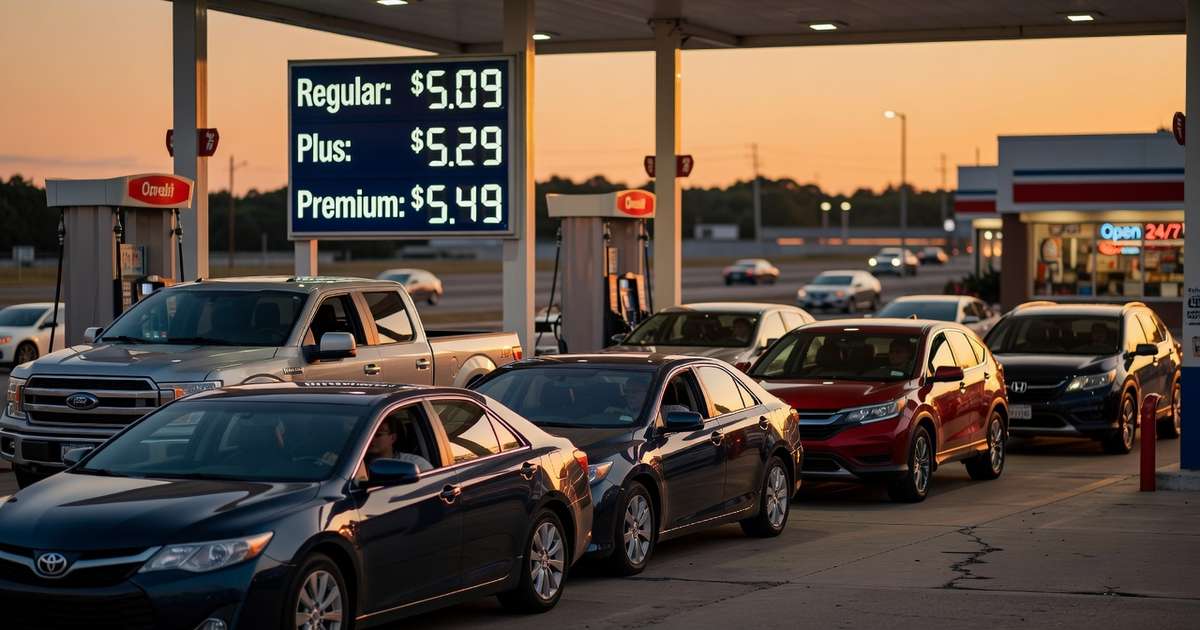
The energy index rose 3.9 percent in May after climbing 3.8 percent in April and 10.9 percent in March, and the BLS says energy accounted for over sixty percent of the monthly all-items increase. Over the past 12 months energy prices are up 23.5 percent, the kind of move that historically appears only around supply shocks. Gasoline tells the story in one line: up 7.0 percent for the month on a seasonally adjusted basis, up 8.6 percent before adjustment, and up 40.5 percent over the year. Electricity rose 0.6 percent in May and 5.9 percent over 12 months, while natural gas service fell 0.5 percent for the month.
The driver is crude oil. The Iran conflict has kept tanker traffic through the Strait of Hormuz under threat since late May, and the resulting jump in oil prices has been feeding through to pump prices within weeks. The same shock pushed the 10-year Treasury yield toward 4.5 percent in early June and flipped rate-futures markets from pricing cuts to pricing a possible hike. As of June 9, FRED data show the 10-year yield at 4.53 percent and the 2-year at 4.13 percent. Until crude retreats, the gap between headline and core inflation will stay wide, and each monthly CPI print will hinge on what gasoline did.
What It Means for the Fed Next Week
The Federal Open Market Committee meets June 16-17, the first scheduled decision with Kevin Warsh as chair, according to the Federal Reserve’s official meeting calendar. The committee is inside its pre-meeting blackout, so there are no fresh speeches to parse. Markets read the May report as confirmation of a hold: the federal funds target range stands at 3.50 to 3.75 percent, with the effective rate at 3.62 percent as of June 9. The Fed’s preferred inflation gauge, the PCE price index, ran 3.8 percent headline and 3.3 percent core in April, and the April PCE report had already cemented expectations that June would bring no change.
The harder question is what comes after June. CNBC and Fortune both report that Warsh views the oil shock as a supply event the Fed should not chase, and he has argued that productivity gains from artificial intelligence will push inflation down over time. The soft 0.2 percent core print gives that position cover. But the run of data is uncomfortable: three straight months of rising annual CPI, a strong May jobs report, and futures traders who now see the next policy move as more likely a hike than a cut, possibly as soon as the December 8-9 meeting. A second straight 4-handle headline reading on July 14 would make the debate considerably louder.
What 4.2% Inflation Changes for Your Money
For borrowers, the report changes nothing immediately. The prime rate has held at 6.75 percent since December 11, 2025, per FRED’s bank prime loan rate series, and it only moves when the Fed moves. Variable credit card APRs and HELOCs priced off the fed prime rate stay where they are, and you can compare today’s averages on our consumer credit rates dashboard. For savers, the math just got tighter: a top high-yield savings account paying around 4 percent now roughly matches headline inflation, which means the real return on cash is close to zero until either yields rise or gasoline retreats. Locking a competitive CD rate protects against cuts but not against an inflation overshoot. For homebuyers, mortgage rates follow the 10-year Treasury, which at 4.53 percent is already carrying an inflation premium; another hot CPI print would pressure it higher.
Pro Tip: When headline inflation runs above your savings yield, every idle dollar quietly loses purchasing power. Compare what your bank actually pays against the top nationally available rates, and consider splitting cash between a high-yield savings account for liquidity and short Treasury bills, which are exempt from state income tax. If you carry a balance on a variable-rate card, a hold at 6.75 percent prime is your window to pay it down before any 2026 hike raises your APR.
Frequently Asked Questions
Will the Fed raise rates next week because inflation hit 4.2 percent?
Almost certainly not at the June 16-17 meeting. Futures markets continued to price a hold after the report, according to CNBC reporting on CME FedWatch data, because the core index rose only 0.2 percent in May and the spike is concentrated in energy. The Fed typically avoids reacting to supply-driven oil shocks, and Chair Kevin Warsh has said he views this one as exactly that. The live debate is about the second half of 2026, where traders now assign meaningful odds to a hike rather than the cuts they expected this spring.
Why did headline inflation jump if core CPI only rose 0.2 percent?
Energy is the entire gap. The BLS says energy accounted for over sixty percent of May’s monthly increase, with gasoline up 7.0 percent in a single month and 40.5 percent over the year as the Iran conflict keeps crude elevated. Core CPI excludes food and energy precisely to filter out this kind of volatility, and at 2.9 percent it sits much closer to the Fed’s comfort zone. The 12-month headline rate also accelerated because the soft monthly prints of spring 2025 dropped out of the calculation and were replaced by three hot months.
What does the May CPI mean for my credit card APR and HELOC?
Nothing changes yet. Variable card APRs and most HELOCs are priced as the prime rate plus a margin, and prime has been parked at 6.75 percent since December 11, 2025. Because the Fed is expected to hold next week, your rate should stay put through at least midsummer. The risk runs in one direction, though: if persistent energy inflation pushes the Fed toward a hike later in 2026, prime would rise the same day, and card APRs would follow within one or two statement cycles. Paying down variable-rate balances now locks in the benefit.
Will savings account and CD rates change after this report?
Not directly, since banks key deposit pricing off the federal funds rate, which is not moving next week. What changes is the real value of your yield. With headline inflation at 4.2 percent, a savings account paying 4 percent has a slightly negative real return, while it comfortably beat the 3.3 percent inflation rate of March. If markets keep pricing 2026 hike risk, banks have little reason to cut deposit rates, and short-term CD yields could even firm. Savers who expect the energy spike to fade may prefer staying liquid rather than locking long maturities.
How does 4.2 percent inflation affect mortgage rates?
Mortgage rates track the 10-year Treasury yield, not the Fed’s overnight rate, and the 10-year has already repriced for the oil shock, reaching 4.53 percent as of June 9 per FRED data. Bond investors demand extra yield when inflation runs hot, so a second straight headline reading above 4 percent on July 14 would likely push long yields and mortgage quotes higher. The offsetting force is the calm core number: if energy retreats and core stays near 2.9 percent, yields could ease. Buyers should watch the July CPI date as closely as the Fed meeting itself.
When is the next inflation report and the next Fed decision?
The Federal Reserve’s rate decision comes first: the FOMC meets Tuesday and Wednesday, June 16-17, with the statement due at 2 p.m. Eastern on the 17th and Chair Warsh’s press conference afterward. The June CPI report follows on Tuesday, July 14, at 8:30 a.m. Eastern, per the BLS release schedule, and the next FOMC meeting after that is July 28-29. Between those dates, the May PCE price index, the Fed’s preferred gauge, will show whether the energy spike is bleeding into the broader price level. Our trackers update as each release lands.
Watching July 14 and the Fed’s Next Move
One report rarely settles anything, but May’s CPI sharpened the stakes: headline inflation is back above 4 percent for the first time in three years while core stays near 3. The June 16-17 decision looks settled; the path afterward does not. Follow the Fed meeting schedule, see our 2026 fed rate forecast, and track every benchmark on the U.S. interest rates dashboard as the July data arrives.
References
- U.S. Bureau of Labor Statistics, Consumer Price Index, May 2026 (released June 10, 2026): bls.gov/news.release/archives/cpi_06102026.htm
- Federal Reserve Bank of St. Louis, FRED, Bank Prime Loan Rate (DPRIME): fred.stlouisfed.org/series/DPRIME
- Federal Reserve Bank of St. Louis, FRED, Federal Funds Effective Rate (DFF): fred.stlouisfed.org/series/DFF
- Federal Reserve Bank of St. Louis, FRED, 10-Year Treasury Constant Maturity Yield (DGS10): fred.stlouisfed.org/series/DGS10
- Federal Reserve Bank of St. Louis, FRED, 2-Year Treasury Constant Maturity Yield (DGS2): fred.stlouisfed.org/series/DGS2
- Board of Governors of the Federal Reserve System, FOMC Meeting Calendars: federalreserve.gov/monetarypolicy/fomccalendars.htm