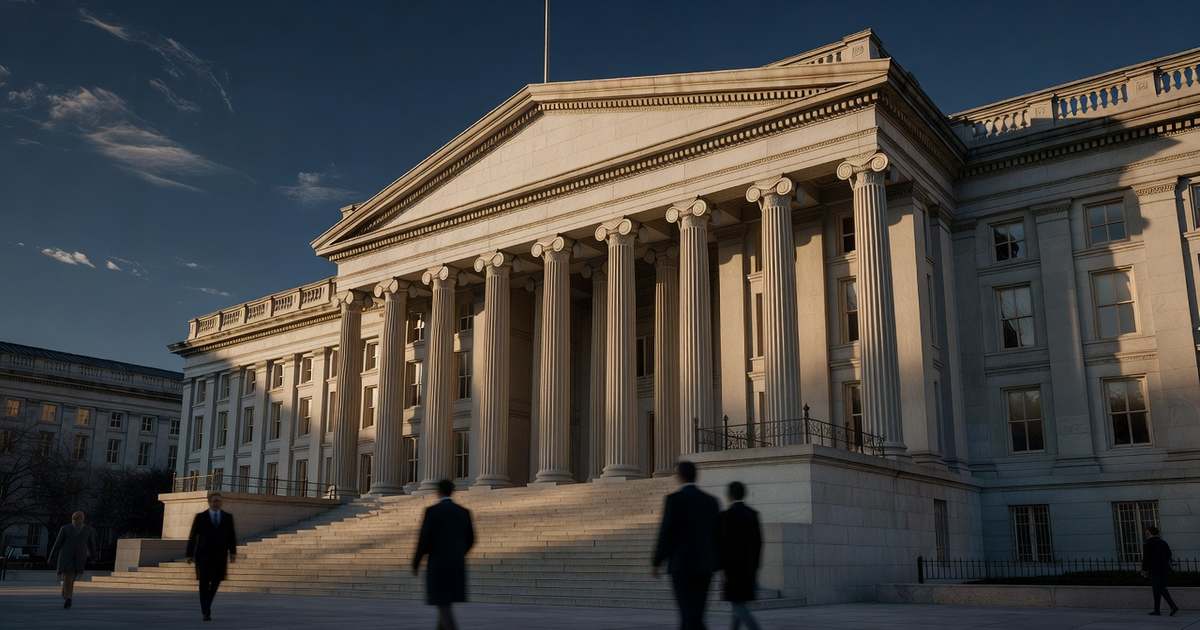
The Treasury Department will sell $119 billion of notes and bonds over three sessions this week, and it will do so without a word of guidance from the Federal Reserve. Treasury posted the offering announcements on September 3: a $58 billion three-year note on Tuesday, September 8, a $39 billion reopening of the 10-year note on Wednesday, September 9, and a $22 billion reopening of the 30-year bond on Thursday, September 10. The sales land inside the Federal Open Market Committee communications blackout, which began Saturday, September 5 and runs through Thursday, September 17, covering the September 15 and 16 policy meeting. Buyers will price $119 billion of new federal borrowing with no fresh signal from any policymaker. The backdrop shifted on Friday. Yields climbed after the August employment report showed payrolls rose 162,000, and the three-year note closed the week at 4.45%, sixteen basis points above the 4.291% that cleared the comparable August 11 sale. Federal debt stood at $40,102,964,278,586.10 on September 3, according to Treasury’s daily debt figure. Every basis point added at these sales compounds across a stack that size, which is why the week matters well beyond the trading desks that bid at it. The yield curve going into Tuesday is the steepest part of the story.
Key Takeaways
- Treasury sells $119 billion of notes and bonds on September 8, 9 and 10, six billion dollars less than August’s refunding week.
- The three-year note closed Friday at 4.45%, sixteen basis points above the 4.291% that cleared the August 11 auction.
- Federal debt reached $40.10 trillion on September 3, of which $32.42 trillion is held by the public.
- The average rate Treasury pays across all its debt hit 3.490% in August, the highest reading since May 2009.
- Fed officials stay silent until September 17. The prime rate holds at 6.75% through the auctions.
Table of Contents
What Treasury Announced
Treasury’s Bureau of the Fiscal Service published three coupon offering announcements on September 3. The three-year note carries CUSIP 91282CRL7 and is a new issue of $58 billion, auctioned Tuesday. The 10-year comes as a reopening of CUSIP 91282CRF0, the note first sold on August 12, for $39 billion on Wednesday. The 30-year bond reopens CUSIP 912810UW6, the bond first sold on August 13, for $22 billion on Thursday. Because Monday is the Labor Day holiday, the entire coupon calendar compresses into Tuesday through Thursday.

Bills go alongside. Treasury will sell $75 billion of six-week bills, $92 billion of 13-week bills and $79 billion of 26-week bills on Tuesday, which puts $304 billion of federal paper into the market in a single session. The bill auctions are routine rollovers and rarely move rates. The coupons are the ones that set the government’s long-term cost, and they are the ones dealers watch. All three settle before the FOMC announces its September decision, so the results become part of the evidence the market reads into that meeting rather than a reaction to it.
How the Week Compares With August
August was a refunding month, and refunding months carry the heaviest coupon supply. Treasury sold $58 billion of three-year notes on August 11 at a high yield of 4.291% with a bid-to-cover ratio of 2.71. It followed with $42 billion of new 10-year notes on August 12 at 4.683% and a 2.53 cover, then $25 billion of new 30-year bonds on August 13 at 5.216% and a 2.39 cover. Those three sales totaled $125 billion. September’s $119 billion is $6 billion smaller, entirely because the 10-year and the 30-year come as reopenings rather than new issues.
Price is the part that moved. Treasury’s par yield curve closed Friday, September 4 with the three-year at 4.45%, the 10-year at 4.78% and the 30-year at 5.24%. Measured against the August stops, the three-year is roughly 16 basis points cheaper for the government, the 10-year about 10 basis points cheaper and the 30-year about 2 basis points cheaper. The three-year comparison is the one with history behind it. Treasury has not stopped a three-year note at 4.45% or higher since June 10, 2024, when one cleared at 4.659%. Rising interest costs on the debt start at auctions like these.
What the Borrowing Costs
Treasury’s own bookkeeping shows the bill arriving. The average interest rate across all interest-bearing federal debt reached 3.490% on August 31, up from 3.447% in July and the highest monthly reading since May 2009, when the figure was 3.524%. That average has climbed every month since February. It rises not because the Fed moved, but because low-coupon notes issued during the 2020 and 2021 borrowing wave keep maturing and get replaced at today’s yields, which is exactly what Tuesday’s $58 billion three-year note will do.
The running totals are large. Through the first eleven months of fiscal 2026, accrued interest on Treasury notes came to $454.80 billion and interest on Treasury bonds to $162.88 billion, while amortized discount on Treasury bills added $231.82 billion. August alone accounted for $44.31 billion of the note figure. Set against total debt of $40.10 trillion on September 3, split between $32.42 trillion held by the public and $7.68 trillion held inside government accounts, the arithmetic of a higher debt burden is straightforward. More debt at higher average coupons means a larger fixed claim on every future budget.
What It Means for Your Rates
Treasury auctions do not set the prime rate. Prime tracks the federal funds target range, which the FOMC has held at 3.50% to 3.75% since July 29, and it sits at 6.75%. Nothing that happens Tuesday through Thursday changes that number. What auctions do change is the level of the intermediate and long Treasury yields that lenders use to price fixed-rate consumer credit. The 10-year note is the reference point for mortgage pricing, and the 30-year fixed averaged 6.71% in the week ending September 3, up from 6.66% a week earlier.
Savers see the other side. Bank funding costs follow short Treasury yields, and the 26-week bill auctioned August 31 at a 3.885% discount rate, an investment rate of 4.018%. That is the competition banks price against when they set certificate of deposit rates and high-yield savings yields. Borrowers on the personal side are pricing off a different anchor: fixed personal loan offers key off intermediate yields, and the three-year and five-year parts of the curve are exactly where this week’s supply lands. If the auctions clear at or above Friday’s levels, that pressure carries into offers within weeks, not days.
Pro Tip
If you are shopping a fixed-rate loan or locking a mortgage, get your quote before Thursday’s 30-year sale rather than after it. Lenders reprice off Treasury yields with a lag of a few days, so a quote pulled Tuesday morning still reflects last week’s curve. If you are moving cash into a CD, the opposite logic applies: wait for the bill auction results, then compare what your bank offers against the 4.018% investment rate Treasury paid on six-month paper.
Frequently Asked Questions
What Treasury securities are being auctioned this week?
Treasury is selling $119 billion of coupon securities across three sessions: a $58 billion three-year note on Tuesday, September 8, a $39 billion reopening of the 10-year note on Wednesday, September 9, and a $22 billion reopening of the 30-year bond on Thursday, September 10.
What are Treasury bills selling for right now?
The most recent results give a clean read. The four-week bill auctioned September 3 at a 3.700% discount rate, a 3.762% investment rate. The eight-week stopped at 3.750%. The 13-week cleared August 31 at 3.770% and the 26-week at 3.885%, which works out to a 4.018% investment rate. The 52-week sold September 1 at 3.980%. Short bills yield less than six-month and one-year paper, so the front of the bill curve slopes upward.
What happened at the last 26-week Treasury bill auction?
Treasury sold $79 billion of 26-week bills on August 31 at a high discount rate of 3.885%, equal to a 4.018% investment rate. The bid-to-cover ratio came in at 2.63, meaning bidders submitted $2.63 for every dollar offered. Another $79 billion of 26-week bills goes on the block Tuesday, September 8, and the result will show whether Friday’s employment report changed how dealers price six-month money ahead of the Fed meeting.
Why is the Federal Reserve silent this week?
The FOMC observes a communications blackout that begins the second Saturday before a meeting and ends the Thursday after it. For the September 15 and 16 meeting, that window runs September 5 through September 17. Governor Christopher Waller’s September 3 remarks on the economic outlook were the last public comments before it closed. Dealers therefore bid this week’s auctions on data alone.
Do these auctions change the prime rate?
No. The prime rate is set by banks at a fixed spread over the federal funds target range, and it moves only when the FOMC moves that range. Prime has been 6.75% since the July 29 decision held the target at 3.50% to 3.75%. Auction results shift Treasury yields, which feed fixed-rate mortgages, auto loans and personal loans, but they leave prime and the credit card APRs tied to it untouched.
What should I watch after the auctions?
Two things. First, the high yield on each sale against Friday’s market level: a stop above it signals dealers demanded a concession to absorb the supply. Second, the August consumer price index, which the Bureau of Labor Statistics releases Friday, September 11 at 8:30 a.m. Eastern. That print is the last major data the FOMC sees before it meets, and it will matter more for your borrowing costs than any single auction.
Watching the Week Ahead
Three auctions, one inflation report and then a policy decision, all inside nine days. The auction results will show what investors demand to fund a $40.10 trillion debt at a moment when nobody at the Fed can speak. The August CPI report on September 11 will shape the rest. For the meeting itself, see the FOMC calendar and our 2026 rate outlook. For who actually funds this borrowing, see who owns the debt.
References
- TreasuryDirect. Auction Announcements, Data and Results. Offering announcements dated September 3, 2026.
- U.S. Department of the Treasury. Daily Treasury Par Yield Curve Rates. Close of September 4, 2026.
- Treasury Fiscal Data. Treasury Securities Auctions Data. August and September 2026 results.
- Treasury Fiscal Data. Debt to the Penny. Record date September 3, 2026.
- Treasury Fiscal Data. Average Interest Rates on U.S. Treasury Securities. Record date August 31, 2026.
- Treasury Fiscal Data. Interest Expense on the Public Debt Outstanding. Fiscal 2026 through August.
- Federal Reserve Board. FOMC Meeting Calendar. September 15 and 16, 2026.
- Federal Reserve Board. Waller, The Economic Outlook. September 3, 2026.
- FRED. Bank Prime Loan Rate and 30-Year Fixed Rate Mortgage Average.
- Bureau of Labor Statistics. CPI Release Schedule. August CPI, September 11, 2026.