The gross national debt closed June at $39,462,398,380,774.37, an all-time high, after the Treasury Department’s daily ledger recorded a $117.1 billion single-day increase on Tuesday, June 30. The figure, published in Treasury’s Debt to the Penny dataset, capped the ninth month of fiscal year 2026 with $1.74 trillion in new borrowing since October 1. By Thursday, July 2, the most recent business day on record, the total had settled back to $39.38 trillion as quarter-end accounting entries unwound. Even after that retreat, the government sits less than $625 billion from the $40 trillion mark, a threshold that arrives between mid-September and early October on current borrowing paces.
The record lands at a tense moment for federal finances. The Federal Reserve is holding its policy rate at 3.50 to 3.75 percent while inflation runs above target, which keeps the government’s refinancing costs elevated. The average interest rate on the debt reached 3.353 percent in May, the highest reading of this cycle. The same forces that push federal interest costs higher also anchor the prime rate at 6.75 percent, the benchmark behind most credit cards and home equity lines. The live total updates daily on our current national debt tracker, and our debt-to-GDP ratio page puts the number in context.
Key Takeaways
- The gross national debt hit a record $39.46 trillion on June 30, its highest closing level ever recorded.
- Treasury’s ledger added $117.1 billion in a single day as quarter-end trust fund interest and auction settlements posted.
- Fiscal year 2026 borrowing has reached $1.74 trillion in nine months, roughly $6.3 billion per day.
- Treasury plans to borrow $671 billion from July through September, its heaviest quarter of 2026 so far.
- At current paces, the debt crosses $40 trillion between mid-September and early October 2026.
Table of Contents
What Changed on June 30
Treasury’s Debt to the Penny series shows the total jumping from $39,345.3 billion on Monday, June 29 to $39,462.4 billion at Tuesday’s close. Both sides of the ledger moved. Debt held by the public rose $60.0 billion as end-of-month note and bond auctions settled and new bills were issued. Intragovernmental holdings climbed $57.1 billion, the signature of quarter-end interest being credited to Social Security, military retirement, and other federal trust funds in the form of special-issue securities. June 30 doubles as the government’s semiannual interest-crediting date for several of those funds, which concentrates months of accrued interest into a single business day.

The move partially reversed within two days. By July 2 the total had fallen $87.1 billion to $39,375.3 billion, with intragovernmental holdings giving back $84.7 billion as short-term trust fund positions rolled off. That round trip is routine bookkeeping. The level is not. Every figure in the sequence sits above anything recorded before this quarter, and the June 30 close now stands as the highest debt reading in United States history. The quarter as a whole added $397.0 billion, measured from the March 31 close of $39,065.4 billion to the June 30 peak.
The Fiscal Year 2026 Scorecard
Fiscal year 2026 opened on October 1, 2025 with the debt at $37,637.6 billion. Nine months later the total stands $1,737.7 billion higher, a pace of roughly $6.3 billion per day including weekends and holidays. The twelve-month picture is steeper still: on July 2, 2025 the debt stood at $36,213.8 billion, meaning the government has added $3.16 trillion over the past year. Of the July 2 total, $31.68 trillion is debt held by the public, the portion financed in the bond market, and $7.70 trillion sits in intragovernmental accounts.
The borrowing calendar gets heavier from here. Treasury’s most recent financing estimates, announced May 4, projected $189 billion in privately-held net marketable borrowing for the April through June quarter, assuming a $900 billion quarter-end cash balance. For July through September, Treasury expects to borrow $671 billion, more than the $577 billion it raised in the January through March quarter. The cost of that borrowing keeps grinding higher: the average interest rate on total interest-bearing debt reached 3.353 percent in May, up from 3.340 percent in April and 3.327 percent in March, a climb we detailed in our May average interest rate report.
Why the Debt Keeps Climbing
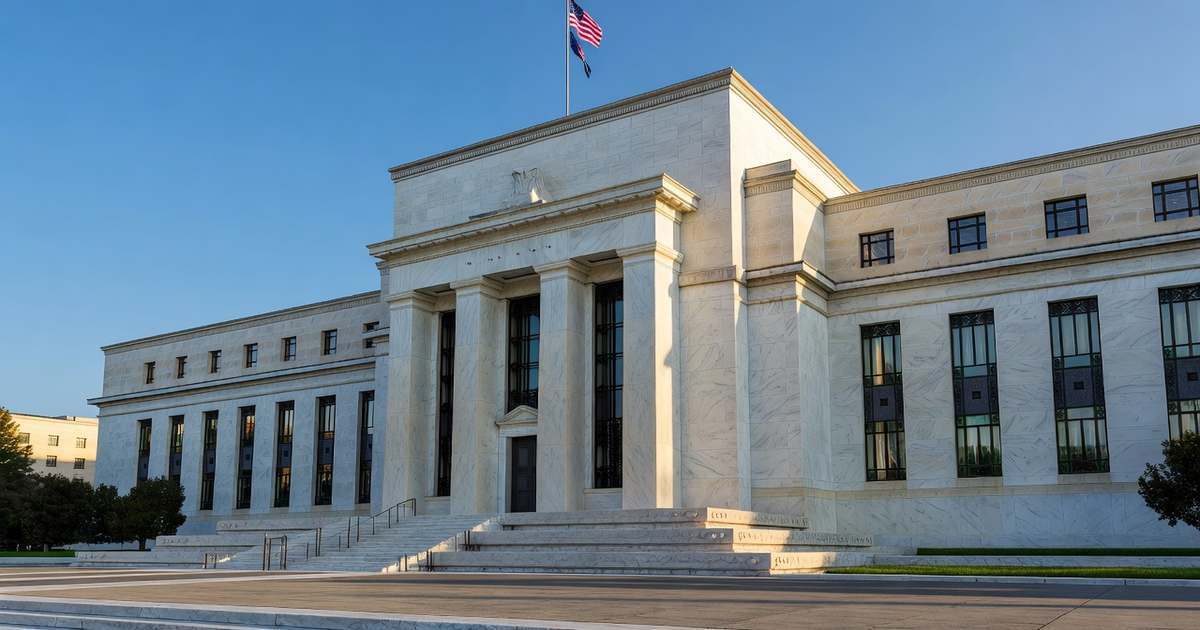
Two engines drive the total: the primary deficit, meaning spending above revenue before interest, and the interest bill itself. The second engine is accelerating because of Federal Reserve policy. At its June 17 meeting, the Federal Open Market Committee voted 12 to 0 to hold the federal funds target at 3.50 to 3.75 percent, said inflation “remains elevated” relative to its 2 percent goal, and declared flatly that “the Committee will deliver price stability.” The committee’s projections flipped toward a possible rate increase this year, a shift we covered after Chair Kevin Warsh’s first meeting. Higher for longer means every maturing security rolls into today’s coupons.

The arithmetic is unforgiving. At May’s 3.353 percent average rate, each additional trillion dollars of debt carries about $33.5 billion in yearly interest, and the full $39.4 trillion stock implies an annualized interest run rate near $1.3 trillion. Market rates offer little relief. The 10-year Treasury yield stood at 4.48 percent on July 1, well above the average coupon on the existing stock, so refinancing old debt raises the average rate even if the Fed never hikes again. Heavy issuance can also demand concessions from buyers, a dynamic visible when 30-year auctions cleared above 5 percent in June.
What It Means for Your Money
Federal borrowing reaches household budgets through two channels. The first is the long end of the bond market: a $671 billion quarter of Treasury supply competes for the same investor dollars that fund home loans, so mortgage pricing tends to track the 10-year yield plus a spread. With the 10-year at 4.48 percent, relief on current mortgage rates depends as much on Treasury supply as on Fed policy. The second channel is the short end. The prime rate sits at 6.75 percent, set as a spread over the Fed’s target, and it governs credit card APRs, HELOCs, and many personal loan rates.
Savers occupy the other side of the trade. The same elevated yields that inflate Washington’s interest bill are holding CD rates and high-yield savings yields at levels unseen for most of the past two decades. If the FOMC follows through on the rate increase its June projections sketched, deposit yields would likely firm further while borrowing costs rise. The next scheduled decision comes at the July 28-29 meeting, per the Federal Reserve’s official calendar.
Pro Tip: Heavy Treasury issuance is keeping deposit yields elevated, but banks reprice quickly once policy turns. If you are holding cash for a known expense 6 to 18 months out, locking a CD now captures today’s yields regardless of what the Fed does on July 28-29. Compare the top nationally available certificates against your current bank’s renewal offer before the next FOMC decision, and keep emergency savings in a high-yield account you can tap without penalty.
Frequently Asked Questions
When will the national debt hit $40 trillion?
The debt stood at $39.38 trillion on July 2, about $625 billion short of the threshold. Fiscal year 2026 borrowing has averaged roughly $6.3 billion per day, which would put the crossing near early October. The faster twelve-month pace of $3.16 trillion per year, about $8.7 billion per day, points to mid-September. Quarter-end spikes complicate the exact date, since a September 30 interest-crediting jump similar to June’s $117.1 billion could push the ledger across the line in a single day.
Why did the debt jump $117 billion in one day?
June 30 combined three flows that normally arrive separately. End-of-month Treasury note and bond auctions settled, adding new marketable debt. New bills were issued against the July 4 holiday week. Most important, June 30 is a semiannual interest-crediting date for major federal trust funds, so Social Security and other accounts received months of accrued interest as special-issue securities in one entry. Debt held by the public rose $60.0 billion and intragovernmental holdings rose $57.1 billion, and most of the intragovernmental move unwound within two days.
What is the difference between public and intragovernmental debt?
Debt held by the public, $31.68 trillion as of July 2, is what Treasury owes to outside investors: households, banks, pension funds, foreign governments, and the Federal Reserve. It is financed at market rates through auctions. Intragovernmental debt, $7.70 trillion, is what one arm of the government owes another, mostly special-issue securities held by the Social Security and federal retirement trust funds. Both count toward the gross total, but only the public portion competes directly with mortgages and corporate bonds for investor money.
How much interest does the government pay on the debt?
Treasury’s average interest rate on total interest-bearing debt was 3.353 percent in May 2026, up from 3.340 percent in April. Applied to a $39.4 trillion stock, that rate implies an annualized interest cost in the neighborhood of $1.3 trillion. The figure keeps rising because maturing securities issued in the low-rate years of 2020 and 2021 are being refinanced at today’s levels, with the 10-year Treasury at 4.48 percent and recent 30-year auctions clearing above 5 percent.
Does the national debt affect my mortgage or loan rates?
Indirectly but powerfully. Mortgage rates price off the 10-year Treasury yield, and that yield reflects how much debt the market must absorb: Treasury plans $671 billion of net borrowing from July through September alone. More supply generally means higher yields, which feed into 30-year mortgage quotes. Your credit card APR and HELOC rate work differently. They key off the 6.75 percent prime rate, which moves only when the Federal Reserve changes its policy target, not when the debt total itself rises.
Will the Fed’s July meeting change the debt’s path?
The FOMC meets July 28-29, and its June projections showed the median official expecting rates to end 2026 higher than today. A hike would raise the government’s cost of rolling over bills and new notes, steepening the interest spiral, while a long hold keeps refinancing costs near current levels. Either way, the primary deficit, meaning spending above revenue, continues adding to the total regardless of Fed policy. Rate decisions change how fast the debt compounds, not whether it grows.
Watching the Road to $40 Trillion
Three dates frame the next leg. Treasury’s June Monthly Treasury Statement, due in mid-July, will show how the deficit tracked through quarter-end. The quarterly refunding announcement in late July sets auction sizes for the $671 billion borrowing quarter. And the FOMC’s July 28-29 decision determines the short-term rate on every bill Treasury rolls this fall. Follow the running total on our U.S. debt hub, the cost breakdown on interest on the national debt, and every upcoming decision on the Fed meeting schedule.
References
- U.S. Treasury Fiscal Data, Debt to the Penny, records through July 2, 2026. fiscaldata.treasury.gov/datasets/debt-to-the-penny/
- U.S. Treasury Fiscal Data, Average Interest Rates on U.S. Treasury Securities, May 2026. fiscaldata.treasury.gov/datasets/average-interest-rates-on-u-s-treasury-securities/
- U.S. Department of the Treasury, “Treasury Announces Marketable Borrowing Estimates,” May 4, 2026. home.treasury.gov/news/press-releases/sb0485
- Board of Governors of the Federal Reserve System, “Federal Reserve issues FOMC statement,” June 17, 2026. federalreserve.gov/newsevents/pressreleases/monetary20260617a.htm
- Board of Governors of the Federal Reserve System, FOMC Meeting Calendars, 2026 schedule. federalreserve.gov/monetarypolicy/fomccalendars.htm
- Federal Reserve Bank of St. Louis, FRED, Bank Prime Loan Rate (DPRIME) and 10-Year Treasury Constant Maturity Rate (DGS10), observations through July 1, 2026. fred.stlouisfed.org/series/DPRIME