The federal government now spends more servicing its debt than it spends defending the country. Net interest outlays reached $722.7 billion in the first eight months of fiscal 2026, from October through May, while national defense cost $630.9 billion over the same stretch, according to the Monthly Treasury Statement published by the U.S. Treasury. That gap of roughly $92 billion is not a one-month quirk. Interest passed defense for the full 2025 fiscal year as well, at $970.4 billion versus $916.6 billion, and the distance between the two lines is widening. Net interest is running 8.8 percent above where it stood a year ago, while defense spending is up 2.9 percent. The cause is straightforward: a $39.4 trillion debt pile is refinancing out of the sub-2 percent coupons of the pandemic era into notes and bonds that now yield well above 4 percent. For households, the same forces that lift the government’s borrowing bill sit behind a prime rate of 6.75 percent and a 10-year Treasury yield near 4.5 percent. This report explains what the numbers show, why interest is climbing so quickly, and what the trend means for the rates you pay.
Key Takeaways
- Net interest reached $722.7 billion through May of fiscal 2026, topping national defense at $630.9 billion by about $92 billion.
- Interest also beat defense for all of fiscal 2025, at $970.4 billion against $916.6 billion, so this is a durable shift.
- The average rate on interest-bearing federal debt rose to 3.353 percent in May, up from 3.320 percent in February.
- The CBO projects net interest near $1.0 trillion this year, climbing to $2.1 trillion by 2036 as low-rate debt keeps rolling over.
- The prime rate holds at 6.75 percent and the 10-year Treasury yield sits near 4.5 percent, keeping consumer borrowing costs elevated.
Table of Contents
Interest Now Costs More Than the Military
The Monthly Treasury Statement breaks federal spending into functional categories, and two of them tell the story of the current budget. Net interest, the cost of servicing the public debt after the government’s own interest income is subtracted, totaled $722.7 billion from October 2025 through May 2026. National defense, which covers the military and related programs, totaled $630.9 billion over the same eight months. A year earlier, those categories stood at $664.4 billion and $612.9 billion. Interest grew by more than $58 billion while defense grew by about $18 billion, so the gap roughly tripled in twelve months.
This is not the first year interest has led. For the full 2025 fiscal year, net interest came in at $970.4 billion against $916.6 billion for defense, so the crossover is now a standing feature of the budget rather than a single data point. Interest has moved ahead of every major spending category except Social Security and health programs such as Medicare and Medicaid. The Treasury updates these figures monthly, and the June statement will extend the fiscal 2026 comparison when it publishes later in July. On the current trajectory, the full-year interest total is on track to set another record and to hold its lead over the Pentagon by a comfortable margin.
Why the Interest Bill Is Climbing So Fast
Two forces drive the interest bill higher. The first is the size of the debt itself. Total public debt outstanding stood at $39.38 trillion as of July 3, split between $31.68 trillion held by the public and $7.70 trillion in intragovernmental holdings, according to the Treasury’s Debt to the Penny dataset. A larger principal balance means more securities paying interest every month. The second force is the average rate the government pays on that balance. The average interest rate on all interest-bearing federal debt rose to 3.353 percent in May, up from 3.320 percent in February and higher for a fourth straight month. On marketable debt alone, the rate reached 3.386 percent.
That average is still low because much of the debt was issued when rates sat near zero. The problem is what happens as those securities mature. When a Treasury note issued in 2020 at a coupon below 1 percent comes due, the government replaces it by selling a new note at today’s yields, which run above 4 percent across most maturities. The 10-year Treasury yielded 4.49 percent and the 30-year 4.98 percent as of July 2, per the Federal Reserve’s H.15 release. Each rollover ratchets the blended rate upward, and because the Treasury refinances trillions of dollars every year, the effect is relentless. The result is a slow-motion repricing of the entire debt stock at levels the budget has not seen in nearly two decades. You can track the components on our interest on the national debt page.
Where It Goes: The CBO Projection
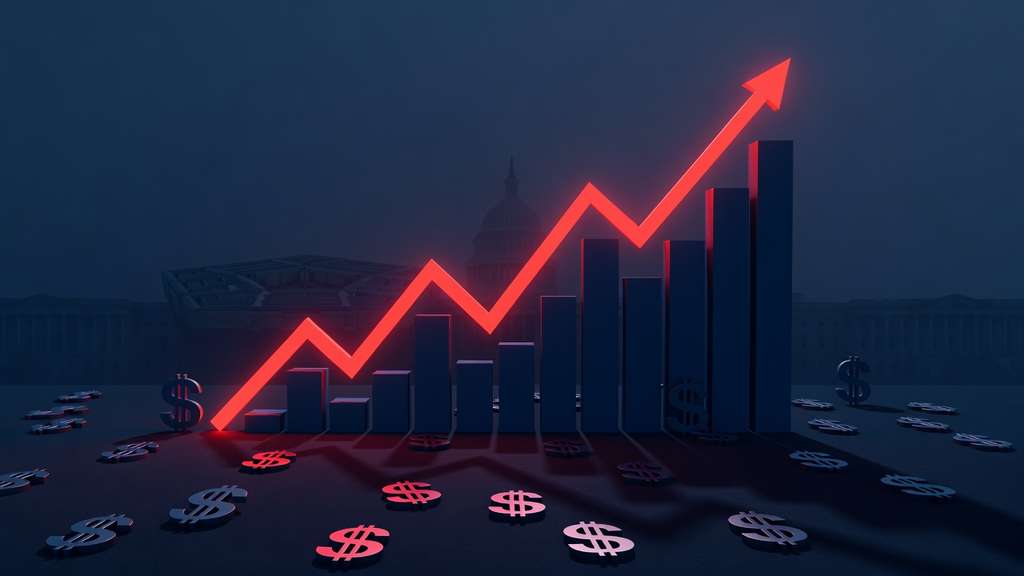
The Congressional Budget Office laid out the path in its Budget and Economic Outlook for 2026 to 2036, released in February. Net interest is projected near $1.0 trillion this fiscal year and rises to $2.1 trillion by 2036, more than doubling over the decade. Measured against the economy, interest climbs from 3.3 percent of gross domestic product to 4.6 percent. The CBO expects the overall deficit to reach $1.9 trillion in fiscal 2026, about 5.8 percent of GDP, and total federal outlays to run at 23.3 percent of GDP. Interest is the fastest-growing line in that budget, outpacing every other category the agency tracks.
The projection depends on where rates settle. If yields drift lower, the refinancing math eases and the interest line flattens. If they hold near current levels or move higher, the trajectory steepens and interest crowds out room for other priorities. That dynamic is why bond investors watch the Treasury’s borrowing needs so closely and why heavy auction weeks, like the coupon sales scheduled for July, draw attention. The government must keep selling debt to fund the deficit and to roll over maturing securities, and it does so at whatever price the market demands. Our federal spending and revenue tracker shows how interest fits against receipts and outlays.
What Rising Interest Costs Mean for Your Wallet
The link between federal interest costs and household rates runs through the same Treasury market. The 10-year yield that reprices the government’s long-term debt also sets the floor for 30-year mortgages, and the short-term rates that shape credit card and personal loan pricing move with the Federal Reserve’s policy rate. The Fed held its target range at 3.50 to 3.75 percent at the June 17 meeting and signaled through its projections that the next move could be a hike rather than a cut. That keeps the prime rate anchored at 6.75 percent, where it has held since December. When Washington’s borrowing costs stay high, yours tend to as well.
There is also a longer-term channel. A rising interest bill widens the deficit, and larger deficits mean more Treasury supply, which can push yields higher still unless demand keeps pace. For borrowers, that argues for locking in fixed rates on large balances rather than waiting for relief that the Fed’s own dot plot no longer promises this year. You can compare current terms on our mortgage rates page and check where variable products stand against the benchmark on our Treasury yield curve dashboard. Understanding the connection between the national debt and your rate sheet is the first step to timing a decision well.
Pro Tip
Rising federal interest costs are a signal that the higher-rate environment is likely to persist. If you carry a balance on a variable-rate card, HELOC, or adjustable loan, price a fixed-rate alternative now rather than waiting for cuts that the June projections pushed out of 2026. Lenders reprice quickly when a Fed move looks likely, and the next decision lands July 29. Our Fed rate forecast tracks how the odds shift week to week.
Frequently Asked Questions
Does the government really spend more on interest than on defense?
Yes. According to the Monthly Treasury Statement, net interest reached $722.7 billion in the first eight months of fiscal 2026, while national defense cost $630.9 billion, a gap of about $92 billion. Interest also topped defense for the full 2025 fiscal year, at $970.4 billion versus $916.6 billion. Net interest is the cost of servicing the public debt after the government’s interest income is subtracted. Only Social Security and the major health programs, such as Medicare and Medicaid, now cost more than interest does.
Why are interest costs rising if the Fed has stopped cutting rates?
Interest costs climb because maturing low-rate debt is refinanced at today’s higher yields. Much of the outstanding debt was issued when rates were near zero, and as those securities come due the Treasury replaces them with new notes and bonds paying above 4 percent. The average rate on interest-bearing federal debt rose to 3.353 percent in May, a fourth straight monthly increase. Even with the Fed on hold, that rollover keeps lifting the blended rate. A larger $39.4 trillion debt base multiplies the effect month after month.
How does the national debt affect the interest rate on my loans?
The connection runs through the Treasury market. The 10-year Treasury yield, which reprices much of the government’s long-term debt, also sets the baseline for 30-year mortgage rates and corporate borrowing. Shorter-term rates that shape credit cards and personal loans track the Federal Reserve’s policy rate and the prime rate that sits three percentage points above its upper bound. When federal borrowing costs stay elevated, the same yields feed into consumer products. That is why the prime rate has held at 6.75 percent while the 10-year yield hovers near 4.5 percent.
What is the average interest rate the government pays on its debt?
The average rate on all interest-bearing federal debt was 3.353 percent as of May 31, according to Treasury data, up from 3.320 percent in February. On marketable debt alone, the figure was 3.386 percent. That average remains well below current market yields because it blends older low-rate securities with newer high-rate issuance. As the older debt matures and is replaced, the average continues to drift toward prevailing yields above 4 percent. This gradual repricing is the main reason total interest costs keep setting records even when the Federal Reserve is not raising rates.
Will rising interest costs push my mortgage or credit card rate higher?
Not directly, but the same forces move together. A growing interest bill widens the deficit, which means more Treasury supply, and heavy supply can keep yields firm unless demand rises to match. Higher yields feed into mortgage rates through the 10-year Treasury, while credit card and personal loan rates follow the prime rate and the Fed’s policy path. With the Fed signaling no cuts this year and possibly a hike, consumer borrowing costs are more likely to stay elevated than to fall. Locking a fixed rate can protect against that risk.
When will federal interest costs stop growing?
Not soon, based on official projections. The Congressional Budget Office expects net interest to rise from about $1.0 trillion this year to $2.1 trillion by 2036, climbing from 3.3 percent of GDP to 4.6 percent. The trajectory would ease only if market yields fell meaningfully or if deficits shrank enough to slow new borrowing. Neither looks likely in the near term, with the deficit projected at $1.9 trillion for fiscal 2026. Interest is the fastest-growing part of the budget, and the rollover of cheap pandemic-era debt still has years to run.
Watching the Next Data Prints
The June Monthly Treasury Statement, due later in July, will extend the fiscal 2026 comparison and show whether the interest lead over defense is still widening. The Treasury’s July coupon auctions will set the yields at which fresh debt is issued, and the Federal Reserve meets again July 28 and 29. Each of those events feeds the same story. For the live figures, follow our U.S. debt tracker, our interest rate dashboard, and our current prime rate page.
References
- U.S. Department of the Treasury, “Monthly Treasury Statement,” outlays by function for net interest and national defense, fiscal 2026 year to date. fiscaldata.treasury.gov/datasets/monthly-treasury-statement
- U.S. Department of the Treasury, “Average Interest Rates on U.S. Treasury Securities,” interest-bearing and marketable debt through May 2026. fiscaldata.treasury.gov/datasets/average-interest-rates-treasury-securities
- U.S. Department of the Treasury, “Debt to the Penny,” total public debt outstanding as of July 3, 2026. fiscaldata.treasury.gov/datasets/debt-to-the-penny
- Congressional Budget Office, “The Budget and Economic Outlook: 2026 to 2036,” February 2026, net interest and deficit projections. cbo.gov/publication/62105
- Federal Reserve Board, “H.15 Selected Interest Rates,” Treasury yields and the prime rate as of July 2, 2026. federalreserve.gov/releases/h15
- Federal Reserve Board, “Federal Open Market Committee statement,” June 17, 2026 policy decision. federalreserve.gov/newsevents/pressreleases/monetary20260617a.htm