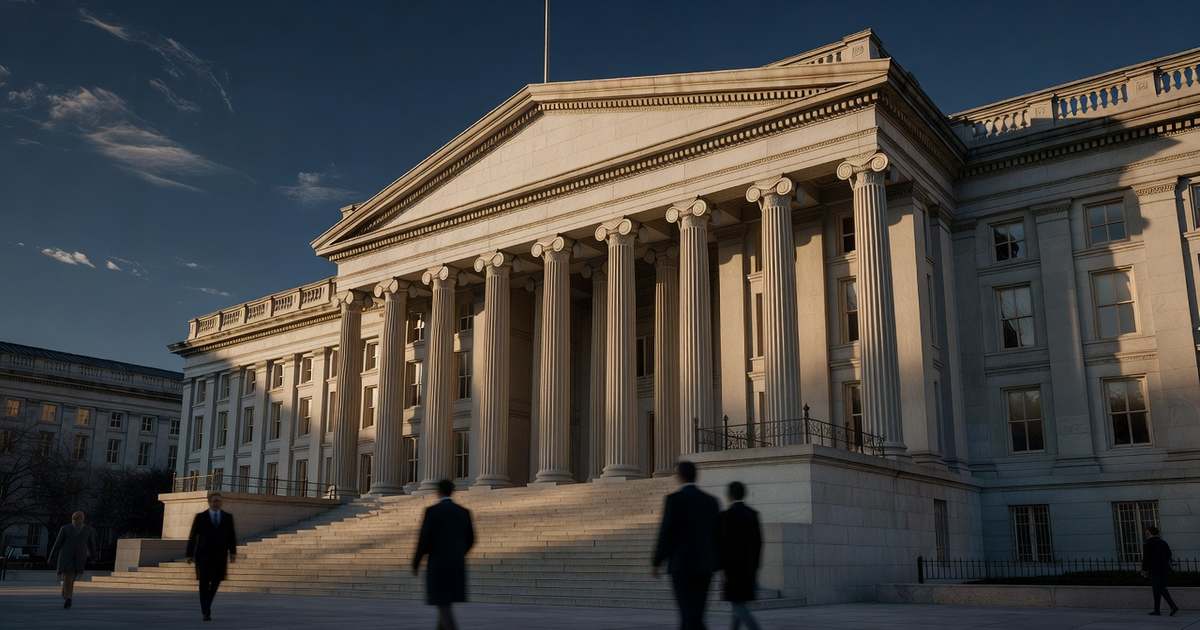
The federal debt grew $2.46 trillion during fiscal year 2026 and finished the year at $40.097 trillion, the first full fiscal year in American history to close above $40 trillion. Treasury’s Debt to the Penny series put total public debt outstanding at $40,096,954,633,566.68 on September 29, the final reading published before the fiscal year ended Wednesday, September 30. Twelve months earlier, on September 30, 2025, the same series read $37,637,553,494,935.61. The $2,459,401,138,631 added over those twelve months works out to a 6.5% increase, roughly $205 billion a month and about $6.7 billion a day. Debt held by the public, the portion sold into markets, accounted for $2.09 trillion of the increase and ended at $32.368 trillion. Intragovernmental holdings, mostly Social Security and Medicare trust fund balances, added $369 billion to reach $7.729 trillion. The year closed with the current national debt higher than at any previous fiscal year end, and with the government paying more to carry it than at any time since 2009. For the longer series, see our national debt hub. The number matters now because fiscal 2027 opens with 10-year Treasury yields above 5% and the prime rate at 7.00%.
Key Takeaways
- Federal debt ended fiscal 2026 at $40.097 trillion, up $2.46 trillion, or 6.5%, in a year.
- Debt held by the public rose $2.09 trillion to $32.368 trillion; trust fund holdings added $369 billion.
- The weighted average interest rate on the debt reached 3.490% in August, the highest since May 2009.
- CBO counted a $2.0 trillion deficit through eleven months of fiscal 2026.
- Borrowing averaged about $205 billion a month, roughly $6.7 billion a day.
Table of Contents
What Changed in Fiscal 2026
Fiscal 2026 was the year the debt crossed a long-approaching threshold. Treasury first reported total public debt outstanding above $40 trillion in mid August, and the balance stayed there for the rest of the year. The August 31 reading of $40,175,641,071,634.14 was the high-water mark. September ran the other way. The September 29 figure of $40.097 trillion sat $78.7 billion below the August close, a decline that reflects Treasury drawing down its cash balance at the Federal Reserve rather than any drop in borrowing needs. Cash management of that kind is routine and does not change the annual arithmetic.

The year-over-year comparison is the cleaner read. Measured from fiscal year end to fiscal year end, the government added $2,459,401,138,631 to the debt. It is the second consecutive year of borrowing above $2 trillion, and it came without a recession or an emergency spending package. Treasury financed the gap by expanding auction sizes across the bill, note, and bond calendar. On September 29 the department sold $85 billion of six-week bills at 3.970% and $54 billion of 52-week bills at 4.400%, then followed on September 30 with $75 billion of 17-week bills at 4.115%.
Where the Borrowing Came From
The Congressional Budget Office counted a $2.0 trillion deficit through the first eleven months of fiscal 2026 in its September 11 monthly budget review. CBO flagged the year-over-year comparison as distorted by payment timing around Labor Day. Adjusted for those shifts, the eleven-month shortfall ran $82 billion larger than the prior year. The Committee for a Responsible Federal Budget noted in August that the government had already borrowed more in ten months of fiscal 2026 than in all of fiscal 2025.
Debt grew faster than the deficit, which is normal. The deficit measures the gap between what the government collects and spends in a year. The debt figure also absorbs trust fund accruals, cash balance swings, and the refinancing of maturing securities at whatever rate the market demands. That last piece did most of the extra work in fiscal 2026. Securities issued in 2020 and 2021 at yields near 1% matured and were replaced at 4% to 5%, lifting the carrying cost with no new policy decision. CBO’s February outlook had projected a $1.9 trillion full-year deficit and debt held by the public at 101% of gross domestic product.
The Interest Cost of a $40 Trillion Debt
The weighted average interest rate Treasury pays across all interest-bearing debt reached 3.490% in the August report, the highest monthly reading since May 2009. It has risen in every month of calendar 2026, climbing from 3.316% in January, and it stood at 3.363% at the close of fiscal 2025. That increase of about 13 basis points sounds small until it is applied to a balance above $40 trillion, where each basis point is worth roughly $4 billion a year once the full stock reprices. Within the marketable portfolio, bills averaged 3.788%, notes 3.345%, and bonds 3.453% in August.

CBO reported that interest costs through eleven months of fiscal 2026 ran $111 billion above the same period a year earlier, a 12% increase, and attributed it to both the larger balance and higher long-term yields. The pressure has not eased. The Federal Reserve’s H.15 release for September 29 showed the 10-year Treasury constant maturity at 5.26% and the 30-year at 5.59%, levels that will price the notes and bonds Treasury sells in early fiscal 2027. The 7-year note auctioned September 24 cleared at 5.085%. Each replaces paper issued at a fraction of that yield, so the average rate has further to climb even if market yields stop rising.
What a Bigger Debt Means for Your Rates
The debt total does not reach household borrowing costs directly. Treasury yields do. When the government sells more paper into a market already absorbing record supply, buyers ask for more yield, and that yield prices most consumer credit tied to the long end. The 10-year note at 5.26% is the anchor beneath current mortgage rates, and the spread between the two has stayed wider than its pre-2022 norm. Short-term credit works differently. Credit cards, home equity lines, and most variable personal loans are indexed to the prime rate, which banks set by convention 300 basis points above the top of the Fed’s target range. The Fed raised that range at its September 15 and 16 meeting, and the fed prime rate moved to 7.00%, where H.15 still showed it on September 29.
Savers sit on the other side of the same trade. Treasury’s funding needs have kept bill yields elevated, with 52-week paper clearing at 4.400% in the last auction of the fiscal year, and that competition sets a floor under what banks must pay to hold deposits. The spread between the best and the median offer stays wide, which is why comparing CD rates and high-yield savings accounts pays. Borrowers face the mirror image, and anyone carrying a variable balance should weigh fixed-rate alternatives against personal loan rates today before the Federal Open Market Committee meets October 27 and 28.
Pro Tip
If you carry a credit card or home equity balance, the prime rate at 7.00% is the number that governs your APR, not the $40 trillion headline. Check your statement for the index and the margin, then calculate what a further 25 basis point move would add over a year. On a $10,000 balance that is about $25, small on its own but compounding with each future increase. Paying down variable balances first removes the exposure.
Frequently Asked Questions
How much did the national debt grow in fiscal 2026?
The federal debt grew $2.46 trillion in fiscal year 2026, rising from $37.638 trillion on September 30, 2025 to $40.097 trillion on September 29, 2026, the last reading Treasury published before the year closed. That is a 6.5% increase, or about $205 billion a month.
Why did the debt grow more than the annual deficit?
The deficit measures one year of spending minus receipts. The debt balance captures more. It absorbs interest credited to the Social Security and Medicare trust funds, swings in Treasury’s cash position, and the refinancing of maturing securities at current market yields. In fiscal 2026 that refinancing mattered most, because paper sold in 2020 and 2021 at yields near 1% came due and was replaced at 4% to 5%. CBO counted a $2.0 trillion deficit through eleven months while the debt rose $2.46 trillion over twelve.
Does a bigger national debt raise my credit card APR?
Not directly. Your card APR is almost always the prime rate plus a margin your issuer sets, and prime moves only when the Federal Reserve changes its target range. Prime stands at 7.00% after the September meeting. The debt total influences long-term Treasury yields, which feed mortgages and other fixed-rate credit, but it does not enter the card formula. If your APR rose this year, the cause was the Fed decision, not the Treasury balance. Check your cardholder agreement for the index and margin that apply.
What does the average interest rate on the debt tell you?
It is the weighted cost of carrying the entire balance, and Treasury publishes it monthly. At 3.490% in August it reached the highest level since May 2009, up from 3.363% a year earlier. The figure moves slowly because only a slice of the debt reprices each month, which also means it keeps rising for a long stretch after market yields peak. With the 10-year at 5.26%, the average has further to travel before it reflects today’s market, and each basis point costs roughly $4 billion annually.
How much interest does the government pay each year?
Interest costs through the first eleven months of fiscal 2026 ran $111 billion above the same period a year earlier, a 12% increase, according to CBO. The agency’s February outlook put full-year net interest above $1.0 trillion, or 3.3% of gross domestic product. Final fiscal-year totals arrive with Treasury’s Monthly Treasury Statement for September, due in mid October. Interest is now among the largest single line items in the budget, and it grows automatically as older low-yield securities mature and are refinanced at current rates.
When is the official September 30 debt figure published?
Treasury publishes Debt to the Penny one business day after the date it covers, typically in the afternoon Eastern time. The September 30 close, the official final balance for fiscal 2026, posts on October 1. The September 29 reading of $40,096,954,633,566.68 is the last figure available until it lands, and the two are rarely far apart. The fuller accounting comes with the Monthly Treasury Statement in mid October, which reports September receipts, outlays, and the final fiscal-year deficit for the federal government.
Watching the Opening Weeks of Fiscal 2027
Three dates shape the next stretch. Treasury’s Monthly Treasury Statement for September lands in mid October with the final fiscal 2026 deficit and full-year interest on the national debt. The Federal Open Market Committee meets October 27 and 28, the next decision on the current prime rate. Treasury’s quarterly refunding announcement follows in early November and sets auction sizes into year end. Our Treasury yield curve page tracks the market between those events.
References
- U.S. Department of the Treasury, Bureau of the Fiscal Service, Debt to the Penny, readings for September 29, 2026 and September 30, 2025.
- U.S. Department of the Treasury, Bureau of the Fiscal Service, Average Interest Rates on U.S. Treasury Securities, August 2026.
- Board of Governors of the Federal Reserve System, H.15 Selected Interest Rates, released September 30, 2026.
- Congressional Budget Office, The Budget and Economic Outlook: 2026 to 2036, February 2026.
- U.S. Department of the Treasury, TreasuryDirect auction results, September 24 to September 30, 2026.
- Board of Governors of the Federal Reserve System, FOMC Meeting Calendars, 2026.
- Federal Reserve Bank of St. Louis, 10-Year Minus 2-Year Treasury Spread (T10Y2Y), September 30, 2026.
- Committee for a Responsible Federal Budget, Treasury Confirms $1.8 Trillion Deficit for First 10 Months of FY 2026, August 2026.