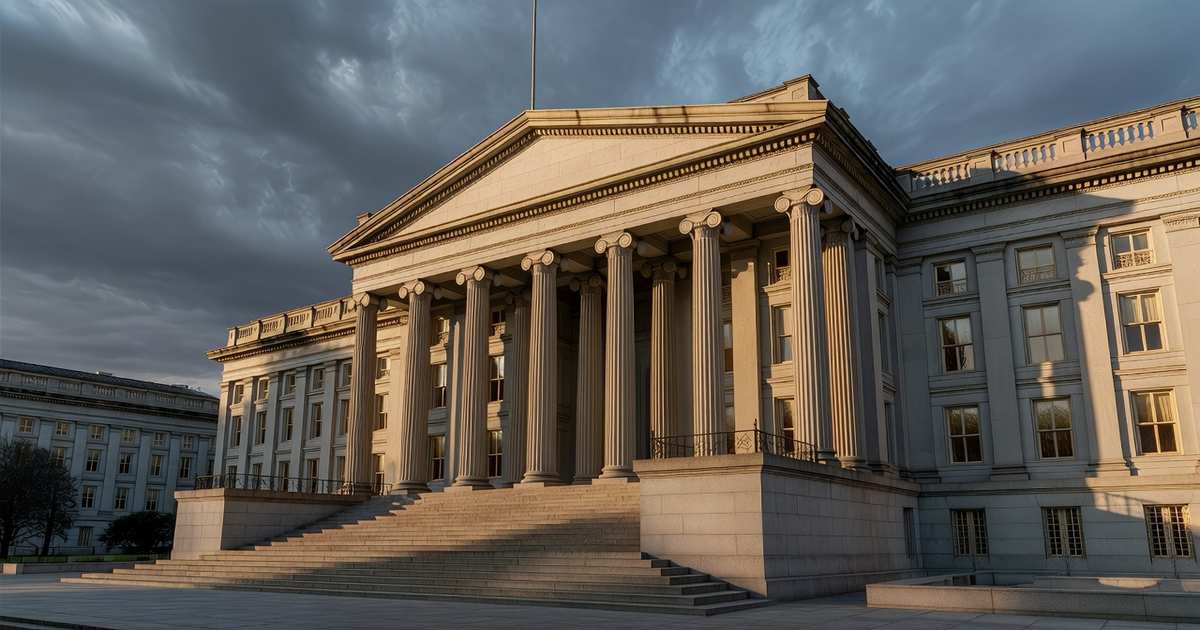
Federal Reserve Governor Christopher Waller said on October 8 that 16 of the 18 officials who filed projections last month expect at least one more rate increase before the end of 2026. Waller spoke at the Istanbul Economic Forum, hosted by the Central Bank of the Republic of Türkiye, 19 days before the Federal Open Market Committee meets October 27 and 28. His speech, “The Signaling Value of the Summary of Economic Projections,” defended the quarterly projection table and its dot plot as a way to signal where rates are heading without committing to a schedule. Four of the 16 marked two increases this year. Waller gave his own position plainly: “I anticipate additional hikes to support a timelier return of inflation to our 2 percent goal.” He added that the increases “do not need to come at consecutive meetings,” which matters because only two meetings remain in 2026. The Committee lifted its target range to 3.75% to 4.00% in September after nine months on hold, and the bank prime loan rate moved with it to 7.00%, reported there every business day through October 8. The policy rate sits on the current prime rate page and the calendar on the Fed meeting schedule page.
Key Takeaways
- Waller said 16 of 18 Fed officials who filed September projections expect another 2026 rate increase.
- Four of them marked two increases, and only the October and December meetings remain.
- The hikes “do not need to come at consecutive meetings,” Waller said.
- Core PCE inflation ran 3.0% through August, above the Fed’s 2% target.
- Prime stands at 7.00%, and the FOMC next meets October 27 and 28.
Table of Contents
What Waller Told the Forum
Waller used the forum to argue about communication rather than to break news. He opened with the September meeting, where the Committee raised its policy rate 25 basis points to a range of 3.75% to 4.00% after nine months on hold. He called the labor market “solid and stable in September,” with unemployment near the median of policymakers’ own longer run estimates. Inflation carried the rest. Core prices for personal consumption expenditures rose 3.0% over the twelve months through August, which Waller called “above our target, and not showing sufficient progress.” Core inflation has held near 2.5% to 3.0% since the spring of 2024, and he rejected the reading that September’s vote rested on one consumer price report.

The rest of the speech set out three ways a central bank can handle public expectations. Saying nothing invites surprises and volatility. Strong forward guidance locks in a schedule and, in Waller’s reading, discounts the data that arrives after the promise. The middle option is signaling, where policymakers indicate the likely total change without committing to the pace or size of each step. “The Summary of Economic Projections (SEP) is serving that signaling role for policymakers,” he said, adding that it “helps to anchor the path of short-term interest rates.” The route is “not predetermined,” he said, with no destination apart from price stability and maximum employment.
What the September Dot Plot Shows
The table Waller was defending went out on September 16, and 18 participants filed entries. The median of their federal funds forecasts put the rate at 4.1% at the end of 2026, about a quarter point above the 3.875% midpoint of the current range. That is the arithmetic behind his count: 16 of 18 marked at least one more increase across October and December, four of them two.
The 2027 row reads less cleanly, and Waller said so. A single year end dot can hide an early increase followed by later cuts, so the level reveals less than the route. Even so, eight participants put the rate 50 basis points above today’s level at the close of 2027. The end of 2027 median also printed 4.1%, flat against 2026, with 3.9% for 2028 and 3.2% for the longer run. The median saw headline PCE inflation at 3.7% for 2026 easing to 2.3% in 2027, core at 3.4% then 2.5%, and unemployment at 4.1% in both years. December 8 and 9 brings the next full round. October does not.
Markets Price More Than the Dots
Waller cited market pricing from the day before his speech: roughly an 85% chance of at least one increase by December and about 80% odds of at least two by March 2027. That is a firmer bet than the dots alone support, and the path to it has not been straight. Reporting in late September put the odds of an October increase near 70% before New York Fed President John Williams said there was “no need for urgency” after the September move. The measure then slid toward 50% and below 30% by the start of October. One meeting and the full path are different questions.

The bond market has leaned the same way. Treasury sold $58 billion of three year notes at 4.932% on October 6, reopened the ten year at 5.300% on October 7 and reopened the long bond at 5.618% on October 8, the highest yield at any Treasury bond auction since August 2000. Yields eased into the end of that week on the Board’s daily schedule, with the ten year constant maturity at 5.22% and the thirty year at 5.60% on October 8, down from 5.28% and 5.67% a day earlier. The two to ten year spread stood at 44 basis points on October 9.
What Another Quarter Point Costs You
Prime is the number that carries an FOMC decision into consumer credit. Banks set it by convention at 300 basis points above the top of the target range, so September’s increase lifted it from 6.75% to 7.00% within a day. Another quarter point in October or December would put prime at 7.25%.
Variable rate products reprice off that index. A card priced at prime plus 13 points sits near 20% APR today and near 20.25% after one more increase, about $2.08 a month per $10,000 of revolving balance, landing one or two statement cycles after the decision. Home equity lines follow on a similar lag. Fixed rate borrowing does not. Thirty year mortgage pricing tracks long Treasury yields and mortgage backed security spreads rather than the policy rate, so the thirty year at 5.60% matters more to a purchase loan than the funds target does, and quotes sit on the current mortgage rates page. Savers get the mirror image more slowly, because deposit rates rise slower than they fall. The best high yield savings accounts, best CD rates and consumer credit rates pages track where offers and spreads stand.
Pro Tip
If you are carrying a revolving balance into the October 27 and 28 meeting, price the downside before it lands. At 7.00% prime, one more quarter point adds about $25 a year per $10,000 of balance. That is modest alone and it compounds against a balance that is not shrinking. A fixed rate consolidation loan takes the index out of the equation, and paying the balance down removes it. Check the rate you would actually qualify for first.
Frequently Asked Questions
How many Fed officials expect another rate hike in 2026?
Sixteen of the 18 Federal Reserve officials who submitted September projections expect at least one more rate increase before the end of 2026, Governor Christopher Waller said on October 8, 2026. Four of those 16 expect two increases. Only the October 27 to 28 and December 8 to 9 meetings remain on this year’s calendar.
What does a dot plot tell you?
The dot plot is one page of the Summary of Economic Projections. Each participant marks where they think the federal funds rate should sit at the end of the next few calendar years and in the longer run, and the entries are published without names attached. It shows the distribution of views alongside the median, so a reader can see both the center of gravity and how wide the disagreement runs. Waller’s argument is that the chart signals a likely total amount of tightening rather than a schedule for delivering it.
Why are there 19 dots on the Fed dot plot?
The chart carries one dot per meeting participant, and the Federal Open Market Committee has 19 participants when every seat is filled: seven Board governors and the presidents of the 12 regional Reserve Banks. All of them submit projections, including the presidents who do not hold a vote in a given year, which is why the count runs above the 12 voting members. The September 2026 round carried 18 entries rather than 19, and one of those did not extend to 2028 and 2029.
When was the last Fed dot plot released?
The most recent one came out on September 16, 2026, at the close of the September Federal Open Market Committee meeting. The Fed publishes the Summary of Economic Projections four times a year, at the March, June, September and December meetings, so the October 27 to 28 meeting will not include one. The next release is scheduled for December 9, 2026. In 2027 the projection meetings fall in March, June, September and December. Between those dates, speeches and the meeting minutes are the main windows into how the distribution is shifting.
What is the forecast for the prime rate?
No one publishes an official prime rate forecast, because banks set prime by convention at 300 basis points above the top of the Fed’s target range rather than by projection. The usable proxy is the dot plot. A September median of 4.1% for the end of 2026 implies one more quarter point increase from the current 3.75% to 4.00% range, which would carry prime from 7.00% to 7.25%. The September median for the end of 2027 also printed at 4.1%, which implies no further change next year.
At what time will the Fed announce a rate decision?
The Federal Open Market Committee releases its policy statement at 2:00 p.m. Eastern on the second day of a two day meeting, which puts the next decision on the afternoon of October 28, 2026. The Chair’s press conference follows at 2:30 p.m. Eastern. Minutes from that meeting arrive three weeks later. Banks that move prime usually post the new rate the same afternoon or the next business day, and card issuers apply it one or two statement cycles after that.
Watching the October Meeting and the December Projections
The October 27 and 28 meeting arrives without a new projection table, so the September dots and speeches like Waller’s are what markets have until December 9. Two inflation rounds land in between, and both speak to the core stall he described. Track the path on the Fed rate forecast page, the transmission into borrowing at how the Fed affects loans, and the long end on the Treasury yield curve page.
References
- Federal Reserve Board, Governor Christopher J. Waller, The Signaling Value of the Summary of Economic Projections, October 8, 2026.
- Federal Reserve Board, H.15 Selected Interest Rates, October 9, 2026 release.
- Federal Reserve Board, Summary of Economic Projections, September 16, 2026.
- Federal Reserve Board, FOMC Calendars, accessed October 11, 2026.
- U.S. Treasury, Fiscal Data, Treasury Securities Auctions Data, October 6 to 8, 2026.
- U.S. Bureau of Economic Analysis, PCE Price Index, August 2026 release.
- Federal Reserve Bank of St. Louis, FRED, 10-Year Minus 2-Year Treasury Spread, October 9, 2026.