The U.S. Treasury sold $69 billion of two-year notes on Tuesday, June 23, 2026, at a high yield of 4.189%, the highest stop for that maturity since January 2025. The sale (CUSIP 91282CQY0, settling June 30 and maturing June 30, 2028) was the government’s first coupon auction since the Federal Reserve’s hawkish June 17 meeting, and traders watched it closely for any sign that the policy shift had dented appetite for short-dated government debt. It had not. The bid-to-cover ratio came in at 2.64, matching the May sale and sitting comfortably above the recent average, while end users took the bulk of the paper. Indirect bidders, the category that captures foreign central banks and other overseas accounts, were awarded 55.3% of the competitive total. Direct bidders took 34.2%, leaving primary dealers with just 10.2%, one of the smallest dealer shares of the year and a clear marker of solid private demand. The result matters because two-year yields track expectations for Fed policy more tightly than any other point on the curve, and you can see the current readings on our Treasury yield curve dashboard. With the prime rate holding at 6.75%, the auction offered the first hard evidence of how investors are pricing the path ahead.
Key Takeaways
- Treasury sold $69 billion of two-year notes on June 23 at a 4.189% high yield, the highest stop since January 2025.
- The bid-to-cover ratio was 2.64, level with May and a sign that demand held up after the Fed’s hawkish turn.
- Indirect bidders took 55.3% and direct bidders 34.2%, leaving primary dealers only 10.2% of the competitive award.
- The sale was the first coupon auction since the June 17 FOMC lifted its 2026 rate projection toward one hike.
- Prime rate is steady at 6.75%, so variable borrowing costs are unchanged for now even as auction yields climb.
What the auction showed
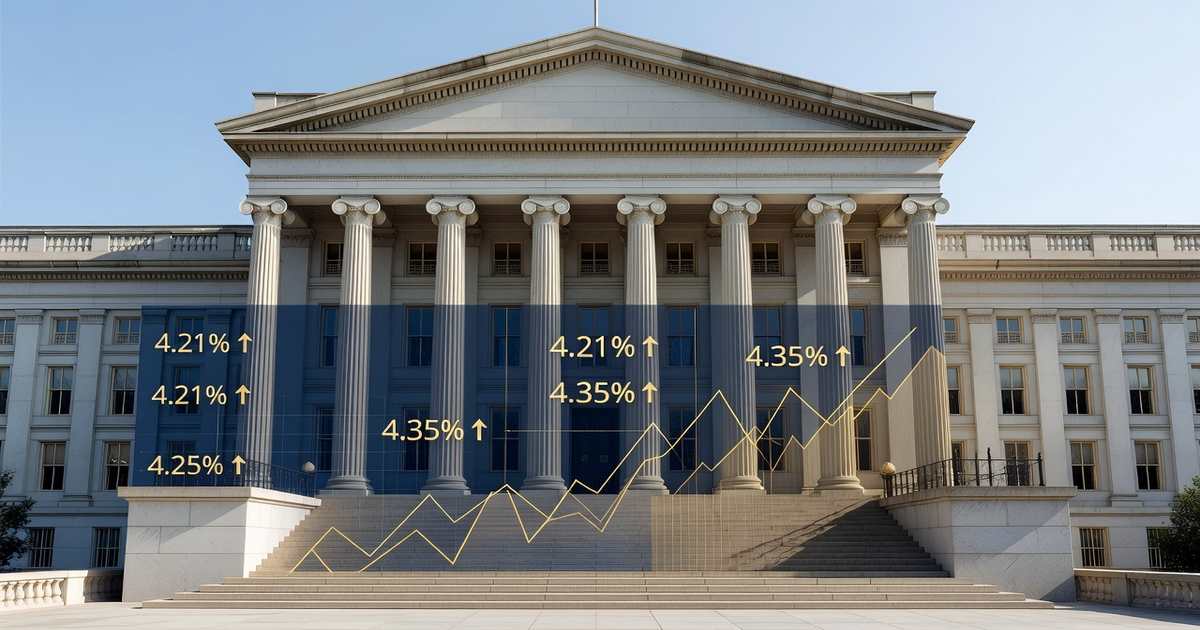
A two-year note auction is the market’s most direct vote on where short-term rates are heading, because the security matures inside the window that the Federal Reserve controls most tightly. Tuesday’s sale stopped at 4.189%, up roughly 12 basis points from the 4.071% high yield at the May 26 auction and the steepest two-year stop since the January 27, 2025 sale cleared at 4.211%. The jump did not come as a surprise. Yields across the front end had already drifted up after the June 17 policy meeting, and the auction simply confirmed that investors were willing to lock in those higher levels rather than wait for better entry points.
The headline metrics told a story of healthy absorption. The bid-to-cover ratio of 2.64 meant investors submitted bids worth about 2.6 times the amount on offer, identical to the prior month and well clear of the soft 2.33 reading at the June 11 thirty-year bond sale. Treasury awarded the notes at a single price to all winning bidders, with the lowest accepted yield at 4.08% and the stop at 4.189%. That tight spread between the low and high yields points to orderly bidding rather than a scramble for safety or a buyers’ strike. For a maturity this sensitive to rate expectations, a clean two-year sale right after a hawkish Fed signal is a meaningful read on conviction.
Where the demand came from
The bidder breakdown is where this auction stood out. Indirect bidders, a group that includes foreign central banks, sovereign funds, and other overseas buyers placing orders through dealers, were allotted 55.3% of the competitive award. Direct bidders, which are typically domestic asset managers and institutions buying for their own accounts, took another 34.2%. Together those two end-user groups absorbed nearly 90% of the sale. That left primary dealers, the two dozen banks obligated to backstop every auction, holding only 10.2% of the competitive total, one of the thinnest dealer takedowns of 2026.
A low dealer share is generally read as a strong signal. Dealers act as buyers of last resort, so when real-money accounts show up in force, dealers are left with less to warehouse and later sell. The pattern echoed the June 16 twenty-year bond sale, where indirect demand reached 71% and dealers were squeezed to a small slice. The takeaway from both sales is that higher yields are doing their job of attracting buyers. At a 4.189% coupon-equivalent return on a two-year horizon, overseas and domestic investors decided the compensation was enough to step in, even with the Fed signaling it may not cut again this cycle and could lean the other way.
Why yields pushed higher
The auction cannot be read apart from the Federal Reserve meeting that preceded it. On June 17, the FOMC held the federal funds target range at 3.50% to 3.75% by a unanimous vote, but the accompanying Summary of Economic Projections delivered the surprise. The median projection for the funds rate at the end of 2026 rose to 3.8%, up from 3.4% in March, implying one quarter-point increase rather than the cuts markets had penciled in earlier this year. It was Chair Kevin Warsh’s first meeting at the helm, and the committee dropped its easing bias while flagging that inflation remains elevated. The two-year note, which prices the average expected funds rate over its life, adjusted upward almost immediately.
The data underneath supports the cautious stance. Consumer prices rose 4.2% over the year through May, the first reading above 4% since 2023, with core inflation at 2.9%. Secondary-market yields reflect the repricing: the two-year traded at 4.24% on June 22, the five-year at 4.29%, the ten-year at 4.51%, and the thirty-year at 4.95%, according to the Treasury par yield curve. Fed funds futures now lean toward a hike by the September meeting, a sharp reversal from the rate-cut bets that dominated the spring. Investors will get their next major input on Thursday, June 25, when the Bureau of Economic Analysis releases the May reading of the personal consumption expenditures price index, the Fed’s preferred inflation gauge.
What it means for your money
Treasury auction yields do not flow straight into your wallet, but they set the gravity for everything that does. The prime rate, which anchors most credit card APRs and home equity lines, sits at 6.75% and moves only when the Fed changes the funds rate, so a higher auction stop leaves your current prime rate untouched for now. What the auction does signal is that the era of cheap money is not returning on the schedule many borrowers hoped for. If the Fed follows its own projection and nudges rates up, variable borrowing costs would edge higher rather than fall.
Savers are the clearer winners. Yields near 4.2% on short government paper keep upward pressure on deposit products, which is why the best high-yield savings accounts and certificates of deposit are still paying competitive rates. Mortgage shoppers should watch the ten-year note rather than the two-year, since home loans track the longer maturity; you can compare offers on our current mortgage rates page. Anyone carrying variable debt or shopping for a fixed-rate personal loan should assume rates stay near current levels into the autumn rather than betting on a quick decline.
If you are sitting on cash you will not need for a year or two, the front end of the Treasury curve is paying you to wait. A two-year note bought near this week’s 4.189% level locks in that yield regardless of what the Fed does next, and the interest is exempt from state and local income tax. Compare that after-tax return against your top savings account before parking everything in a single product.
Frequently asked questions
What does a 2.64 bid-to-cover ratio actually mean?
The bid-to-cover ratio compares total bids submitted against the amount of debt Treasury is selling. A reading of 2.64 means investors offered to buy about 2.6 times the $69 billion on offer, so roughly $182 billion in bids chased $69 billion in notes. Higher numbers signal stronger demand and usually translate into lower borrowing costs for the government. A ratio above 2.5 on a two-year sale is considered solid, and Tuesday’s figure matched the prior month, which tells you appetite held steady even after the Federal Reserve signaled a more hawkish path. A weak reading near 2.2 or below would have flagged buyer hesitation.
Why should I care about a Treasury auction?
Treasury auctions set the baseline cost of money for the entire economy. The yields established at these sales ripple into mortgage rates, auto loans, credit card pricing, and the interest the government pays on the national debt. When two-year yields rise, as they did this week, it tells you the market expects short-term rates to stay elevated, which keeps a floor under what you pay to borrow and what you earn on savings. Watching auctions gives you an early, unfiltered read on rate expectations before those moves show up in the products you use every day.
Will the prime rate change because of this auction?
No. The prime rate is tied directly to the federal funds rate, not to Treasury auction results, and it currently stands at 6.75%. Banks set prime at 3 percentage points above the top of the Fed’s target range, so prime only moves when the FOMC changes policy. The June 23 auction reflects market expectations about future Fed moves, but it does not itself shift the funds rate. If the Fed raises rates later this year as its projections suggest, prime would rise with it. Until then, variable rates linked to prime stay where they are.
Who are indirect bidders and why does their share matter?
Indirect bidders are investors who place auction orders through a primary dealer rather than bidding directly, and the group is dominated by foreign central banks and sovereign accounts. Their 55.3% share of this sale signals that overseas demand for U.S. government debt remains firm. That matters because foreign buyers fund a large slice of federal borrowing, and a pullback would force domestic buyers to absorb more supply at higher yields. A strong indirect share, paired with a thin primary dealer takedown, is one of the clearest signs of a well-received auction and steady global appetite for Treasuries.
How does this connect to the May PCE report?
The personal consumption expenditures price index, due June 25 from the Bureau of Economic Analysis, is the inflation measure the Fed weighs most heavily when setting policy. A hotter-than-expected PCE reading would reinforce the case for the rate hike implied in the Fed’s June projections and could push two-year yields even higher at the next auction. A cooler print would ease that pressure. Tuesday’s sale priced in the market’s current best guess, so the PCE data will either validate the 4.189% stop or force a repricing. Either way, the report is the next major catalyst for short-term rates.
Should I buy Treasuries directly right now?
That depends on your goals, but the math is more attractive than it has been in months. Buying a two-year note near 4.189% locks in that yield until 2028, and Treasury interest is exempt from state and local taxes, which can lift the after-tax return above a comparable savings account in high-tax states. Individuals can bid noncompetitively through TreasuryDirect and receive the same yield the big institutions get. The tradeoff is liquidity: your money is committed for the term unless you sell on the secondary market. Weigh the locked yield against your need for flexible access to cash.
Watching the rest of the auction week
The two-year sale was the opening act of a heavy supply week. Treasury follows with a five-year note auction on Wednesday and a seven-year note on Thursday, and those results will show whether demand extends further out the curve. The May PCE report lands the same morning as the seven-year sale, setting up a direct test of inflation against appetite for government debt. With total federal debt at $39.32 trillion as of June 22, every auction is a referendum on how much investors will pay to finance the government. Track the moves on our Fed rate forecast, the inflation tracker, and our breakdown of the interest cost on the national debt.
References
- U.S. Department of the Treasury, TreasuryDirect, Auction Results: https://www.treasurydirect.gov/auctions/announcements-data-results/auction-results/
- U.S. Treasury Fiscal Data, Debt to the Penny: https://fiscaldata.treasury.gov/datasets/debt-to-the-penny/
- Board of Governors of the Federal Reserve System, H.15 Selected Interest Rates: https://www.federalreserve.gov/releases/h15/
- Board of Governors of the Federal Reserve System, FOMC Calendars and Projections: https://www.federalreserve.gov/monetarypolicy/fomccalendars.htm
- Federal Reserve Bank of St. Louis, FRED, 2-Year Treasury Constant Maturity (DGS2): https://fred.stlouisfed.org/series/DGS2
- U.S. Bureau of Labor Statistics, Consumer Price Index Summary: https://www.bls.gov/news.release/cpi.nr0.htm
- U.S. Bureau of Economic Analysis, Personal Income and Outlays: https://www.bea.gov/data/income-saving/personal-income