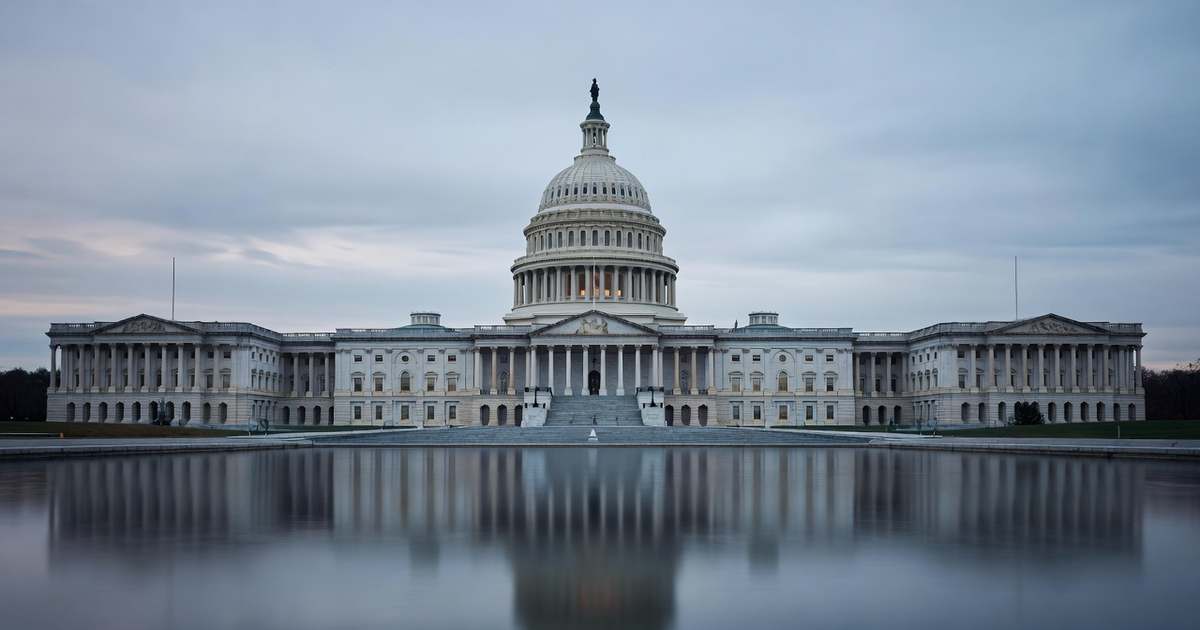
The Congressional Budget Office said on September 24 that federal debt held by the public would reach 222 percent of gross domestic product in 2056 if interest rates settle one percentage point above the agency’s current baseline. That is 47 percentage points above the 175 percent CBO projects under its extended baseline, and both paths start from 101 percent of GDP in fiscal 2026. The analysis, prepared in response to a congressional request, models two departures from the agency’s standard long-run forecast: one in which borrowing costs climb until they sit a full point above baseline, and one in which lawmakers hold the debt-to-GDP ratio flat at this year’s level. Treasury reported total debt outstanding of $40.07 trillion on September 23, of which $32.38 trillion is held by the public. The report landed in the same week Treasury sold seven-year notes at a high yield of 5.085 percent, and it attaches a number to what happens if yields near that level persist. Interest rates are the variable that decides whether the national debt compounds or stabilizes, and the debt-to-GDP ratio is the yardstick Congress uses to judge it.
Key Takeaways
- CBO projects debt held by the public at 222 percent of GDP in 2056 if rates run one point above baseline.
- Its extended baseline puts the same measure at 175 percent, starting from 101 percent of GDP this fiscal year.
- Holding the ratio at 101 percent would need primary deficits averaging 0.2 percent of GDP, against 2.1 percent in baseline.
- Treasury debt outstanding reached $40.07 trillion on September 23, up $2.44 trillion so far in fiscal 2026.
- The average rate Treasury pays on interest-bearing debt hit 3.490 percent in August, the highest reading of 2026.
Table of Contents
What the CBO Analysis Actually Says
CBO built the report around two questions lawmakers asked it to answer. The first asks what happens if interest rates rise until they are one percentage point higher than the extended baseline assumes and then stay there. Under that path, primary deficits, meaning deficits before interest costs, average 2.3 percent of GDP from 2026 through 2056, two-tenths of a point wider than baseline. The compounding does the rest. Debt held by the public finishes at 222 percent of GDP in 2056 rather than 175 percent. The agency’s extended baseline already carries an average interest rate of 4 percent on federal debt and average annual GDP growth of 3.8 percent, so the alternative is not an extreme assumption about markets.

The second question runs the arithmetic backward. CBO asked what primary deficits would have to look like to freeze debt held by the public at its fiscal 2026 level of 101 percent of GDP for the next three decades. The answer is an average primary deficit of 0.2 percent of GDP, which is 1.9 percentage points narrower than the 2.1 percent baseline average. In dollar terms that is a standing adjustment of roughly two percent of output every year, sustained for thirty years, achieved through some combination of lower spending and higher revenue. CBO does not recommend a route. It prices the destination and leaves the choice to Congress.
How Fiscal 2026 Carried the Debt to $40 Trillion
Fiscal 2026 closes on September 30, and Treasury’s daily ledger shows what the year added. Total debt outstanding stood at $37.64 trillion when fiscal 2025 ended on September 30 last year. On September 23 it stood at $40,073,558,531,201.68, an increase of $2.44 trillion across not quite twelve months. Measured against the same date a year earlier, the debt is up $2.60 trillion, or 6.95 percent. The total first closed above $40 trillion on August 18 and set its record of $40.18 trillion on August 31. It has drifted down by about $102 billion since that peak as Treasury ran cash out of its account at the Fed, a pattern that reverses whenever the department rebuilds its balance. Debt held by the public accounts for $32.38 trillion of the September 23 figure, with $7.70 trillion held in government accounts. The public share is the number CBO projects, because it is the portion sold into markets at market yields.
Why the Interest Rate Assumption Carries the Projection
Treasury’s own books show the mechanism already running. The average interest rate across all interest-bearing federal debt was 3.490 percent at the end of August, up from 3.447 percent in July and 3.363 percent a year earlier. That figure moves slowly because most of the debt is locked into securities issued years ago at lower coupons. Every maturing bill and note, though, is refinanced at today’s yields. On September 23 the two-year Treasury yielded 4.85 percent, the ten-year 5.11 percent and the thirty-year 5.40 percent. The following afternoon Treasury sold $44 billion of seven-year notes at a high yield of 5.085 percent with a bid-to-cover ratio of 2.42.

Put those two facts side by side and the CBO scenario stops looking hypothetical. The government is paying an average of 3.490 percent on its stock of debt while issuing new paper above 5 percent. CBO’s extended baseline assumes the average settles near 4 percent. Its alternative asks what happens at roughly 5 percent instead, which is close to where the market is clearing new seven-year and ten-year supply this month. The Federal Reserve raised its target range to 3.75 percent to 4.00 percent on September 16 in a unanimous vote, citing inflation that remains elevated, so the short end of the curve is not offering relief either.
What Federal Borrowing Costs Mean for Your Money
Federal borrowing costs and household borrowing costs move through the same yield curve, so a projection about Treasury debt is also a statement about consumer credit. The ten-year Treasury yield at 5.11 percent is the anchor lenders use to price thirty-year mortgages, which is why current mortgage rates have stayed high through 2026. The short end works differently. Credit card APRs, home equity lines and most variable-rate personal loans track the prime rate, which moved to 7.00 percent after the September 16 hike and has held there since. Savers are on the other side of the same trade: the yields on high-yield savings accounts and short-term certificates follow the federal funds target closely, and they have been the clearest benefit of this rate cycle. If CBO’s higher-rate scenario is the one that plays out, borrowers should plan on variable rates staying near current levels rather than reverting to the cheap money of the past decade.
Pro Tip
If you carry a balance on a variable-rate card or line of credit, price a fixed-rate personal loan against your current APR before the next Fed meeting on October 27 and 28. Prime sits at 7.00 percent, so card APRs reset upward within one or two statement cycles after any further hike. A fixed rate locks your payment; a variable one does not. Run the comparison on the full payoff period, not the monthly payment alone.
Frequently Asked Questions
What did the CBO say about the national debt on September 24, 2026?
CBO projected that federal debt held by the public would reach 222 percent of GDP in 2056 if interest rates run one percentage point above its baseline, compared with 175 percent under the baseline itself. Both paths begin at 101 percent of GDP in fiscal 2026.
Why does one percentage point on rates change the projection so much?
Interest compounds on a base that is already larger than annual output. A single point applied to roughly $32 trillion of publicly held debt adds hundreds of billions of dollars a year once the stock has fully repriced, and that spending is itself financed with new borrowing. CBO measures the effect over thirty years, which is long enough for nearly every outstanding security to mature and be reissued at the higher rate. The result is 47 percentage points of additional debt relative to GDP by 2056.
How much federal debt is outstanding right now?
Treasury’s Debt to the Penny series put total debt outstanding at $40.07 trillion on September 23, 2026, split between $32.38 trillion held by the public and $7.70 trillion held in government accounts such as the Social Security and Medicare trust funds. The total first closed above $40 trillion on August 18 and reached a record $40.18 trillion on August 31. Fiscal 2026, which ends September 30, has added roughly $2.44 trillion to the total so far.
What interest rate is the government actually paying today?
The average rate across all interest-bearing federal debt was 3.490 percent at the end of August 2026, according to Treasury, up from 3.447 percent in July and 3.363 percent in September 2025. That average lags the market because older securities carry older coupons. New issuance is clearing much higher: Treasury sold seven-year notes at 5.085 percent on September 24, and the ten-year yield closed at 5.11 percent the day before.
Does a rising national debt raise the rate on my loans?
Indirectly, yes. Heavy Treasury issuance competes with private borrowers for the same pool of savings, which tends to lift yields across the curve. Mortgage rates key off the ten-year Treasury, and auto and personal loan pricing follows intermediate yields. Variable consumer rates respond faster to Federal Reserve policy than to the debt itself, so the prime rate is the more immediate driver of card APRs. Over a long horizon the two forces reinforce each other.
What should I watch next on rates and the debt?
Three dates matter. Treasury closes fiscal 2026 on September 30, which fixes the full-year borrowing figure. The Monthly Treasury Statement for September follows in mid-October with final deficit and net interest numbers. The Federal Open Market Committee meets October 27 and 28, and a further increase would push prime above 7.00 percent. Treasury’s monthly average interest rate release, published in the first days of each month, shows how fast the existing debt is repricing.
Watching the Final Days of Fiscal 2026
The fiscal year ends Tuesday, and the closing figure will set the denominator for every debt comparison published this autumn. October brings the September Monthly Treasury Statement, a fresh average interest rate print and the October FOMC decision, each of which tests one input in CBO’s arithmetic. Track the running total on the US debt hub, follow the policy calendar on the Fed meeting schedule, and watch the financing cost itself on interest on the national debt.
References
- Congressional Budget Office. “Projections of Deficits and Debt Under Alternative Scenarios for Interest Rates and the Budget,” September 24, 2026. cbo.gov/publication/62758
- Treasury Fiscal Data. “Debt to the Penny,” record date September 23, 2026. fiscaldata.treasury.gov
- Treasury Fiscal Data. “Average Interest Rates on U.S. Treasury Securities,” record date August 31, 2026. fiscaldata.treasury.gov
- Treasury Fiscal Data. “Treasury Securities Auctions Data,” 7-year note auctioned September 24, 2026. fiscaldata.treasury.gov
- Federal Reserve Board. “FOMC Statement,” September 16, 2026. federalreserve.gov
- FRED. “Bank Prime Loan Rate,” series DPRIME, September 21, 2026. fred.stlouisfed.org/series/DPRIME
- FRED. “10-Year Treasury Constant Maturity Rate,” series DGS10, September 23, 2026. fred.stlouisfed.org/series/DGS10