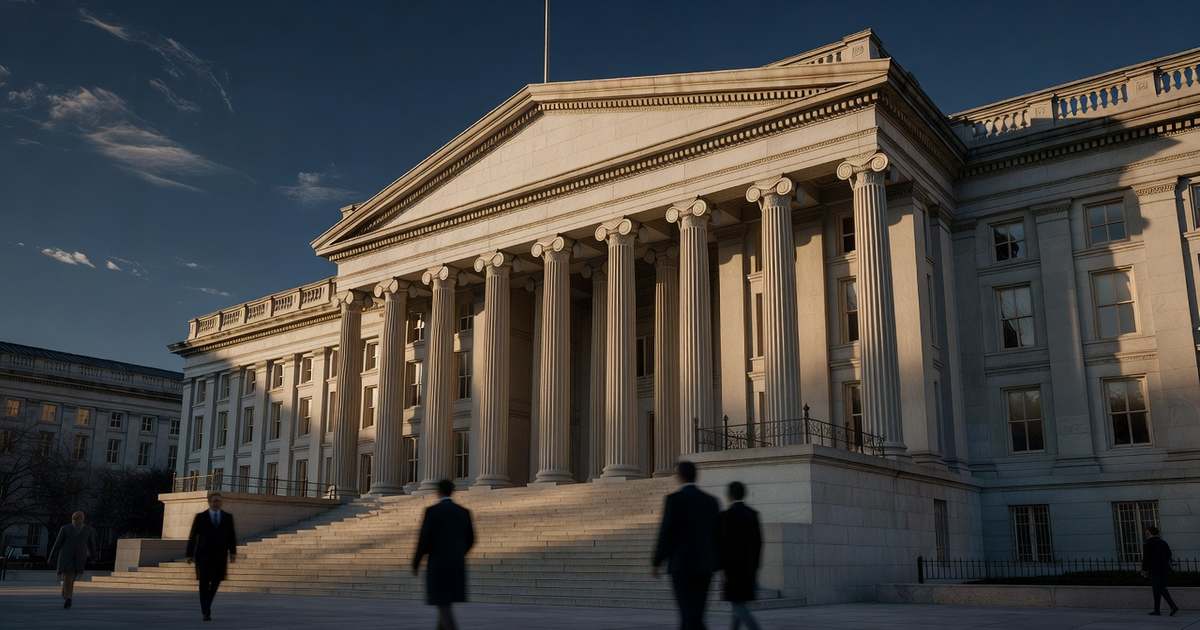
The 10-year Treasury yield fell 17 basis points on Thursday to close at 4.96%, its largest one-day decline since August 2, 2024, and its first close below 5% in a month. Treasury’s daily par yield curve put the 10-year at 4.96% on October 22, down from 5.13% a day earlier, ending a run of 20 consecutive sessions at or above 5%. The decline reached across the curve. The two-year note fell 16 basis points to 4.65%, the five-year fell 17 to 4.78%, the 20-year bond fell 15 to 5.32% and the 30-year fell 13 to 5.29%. The move came as technology and artificial-intelligence shares led an equity selloff that pushed money into government debt, and on the same afternoon Treasury sold $26 billion of five-year inflation-protected notes at a 2.367% real yield. The session matters to borrowers because the 10-year yield, not the federal funds rate, anchors 30-year mortgage pricing. Nothing moved at the short end: the bank prime loan rate held at 7.00% in the Federal Reserve’s H.15 release, and the Federal Open Market Committee does not meet again until October 27 and 28. Our Treasury yield curve tracker and U.S. interest rates dashboard update daily.
- The 10-year Treasury yield closed at 4.96% on October 22, down 17 basis points in one session.
- That is the biggest one-day drop since August 2, 2024, and the first sub-5% close since September 22.
- Yields fell 13 to 17 basis points from the two-year out to the 30-year as equities sold off.
- Treasury’s $26 billion five-year TIPS sale drew a record 32.03% direct-bidder share.
- The prime rate stayed at 7.00%; the next Fed decision lands October 28.
What Changed Across the Curve on Thursday
Treasury’s daily par yield curve for October 22 shows the decline concentrated in the belly and the long end. The three-year, five-year, seven-year and 10-year notes each fell 17 basis points, to 4.72%, 4.78%, 4.86% and 4.96%. The two-year fell 16 basis points to 4.65% and the one-year fell 11 to 4.41%. Bills barely moved: the three-month slipped 3 basis points to 4.22% and the one-month rose 2 basis points to 4.11%. With the front end anchored and the belly rallying hard, the spread between the two-year and 10-year notes narrowed only to 31 basis points from 32, closer to a parallel shift in the coupon sector than a bet on imminent Fed easing.

The size of the move is what sets the session apart. Across 1,201 trading days back to the start of 2022, only four sessions produced a larger one-day fall in the 10-year yield, and the most recent of them was August 2, 2024, when the yield dropped 19 basis points. The 20-year bond’s 15 basis point decline was also its largest since that August 2024 session, and the 30-year’s 13 basis point fall was its largest since November 25, 2024. The 10-year’s close at 4.96% matched the 4.96% print of September 22, the last time the benchmark finished a session below 5%. In between, the yield held at or above 5% for 20 straight sessions, including a 5.48% high on October 19.
The Same-Day TIPS Sale Set a Record of Its Own
At 1 p.m. Thursday, hours into the rally, Treasury closed bidding on $26 billion of five-year Treasury Inflation-Protected Securities, CUSIP 91282CRR4, carrying a 2.250% coupon and maturing October 15, 2031. The notes cleared at a 2.367% real yield, the highest real yield at a five-year TIPS auction since October 19, 2023, when a comparable sale cleared 2.440%. Bids totaled $62.6 billion against $26.0 billion awarded, a bid-to-cover ratio of 2.41. The median accepted yield was 2.300%, with 68.33% of the issue allotted at the high yield. Six months earlier, on April 23, Treasury’s new five-year TIPS cleared at 1.367%, exactly 100 basis points lower.
The allocation is the striking part. Direct bidders, the category that captures investors buying for their own account rather than through a dealer, took $8.33 billion, or 32.03% of the issue. That is the largest direct share recorded at any five-year TIPS auction in TreasuryDirect’s results history, which runs back to April 2006. Indirect bidders, the group that includes foreign and international monetary authorities, took 62.33%. Primary dealers, who are obligated to bid and who absorb whatever the market leaves behind, were left with just 5.46%, or $1.42 billion. A dealer take that small signals end investors stepped up without needing a concession, which is unusual on a day when the broader market was moving quickly.
Why Yields Fell, and What Breakevens Reveal
The proximate cause was equities. Technology and artificial-intelligence shares led a broad selloff on Thursday, with the Nasdaq Composite closing down 2.60% at 26,008.86 and the S&P 500 down 1.21% at 7,663.43, while the Dow Jones Industrial Average finished effectively flat and the Russell 2000 edged higher. Meta shed roughly 7% on questions about its spending plans. Crude oil rose about 2% to $99.07 on Middle East risk. Weekly jobless claims came in better than expected, so the bid for Treasuries did not come from a weak labor print. It came from investors rotating out of richly valued equity and into government paper, which is why the coupon sector rallied and bills did not.

The inflation-protected market tells the more useful story. Treasury’s real yield curve shows the five-year real yield falling 22 basis points on Thursday, to 2.33% from 2.55%, while the five-year nominal yield fell only 17. When the real yield falls further than the nominal yield, the gap between them widens, and that gap is the market’s implied inflation rate. The five-year breakeven rose to 2.45% from 2.40%, according to the St. Louis Fed’s series. In plain terms, Thursday’s rally was not a vote that inflation is cooling. Consumer prices were still running 3.7% above a year earlier in September, by the Bureau of Labor Statistics index. Investors were repricing growth and the real return they require to hold Treasuries, and they were nudging their inflation expectations slightly higher while doing it.
What Changes for Your Money
Mortgage borrowers are the ones who feel this first. Thirty-year fixed mortgage pricing tracks the 10-year Treasury yield, not the federal funds rate, and Freddie Mac’s weekly survey published Thursday morning already had the 30-year fixed average at 7.32%, down from 7.40% a week earlier, with the 15-year fixed at 6.68%. That survey was collected before Thursday’s rally, so quoted rates could ease further if the 10-year holds under 5%. Context matters for anyone shopping: the 30-year average was 7.03% on September 24, so the past month has been a move up, not down. Live pricing sits on our current mortgage rates page.
Everything priced off the short end was untouched. The bank prime loan rate stayed at 7.00% in the Federal Reserve’s H.15 release of October 22, which is what variable-rate credit cards, home equity lines and many small business loans key off, and the effective federal funds rate held at 3.88%. A Treasury rally does not move those; only the Federal Open Market Committee does. Savers should read the bill market rather than the headlines: the three-month bill at 4.22% barely budged, so deposit pricing has no immediate reason to fall. Compare current offers on our best CD rates and high-yield savings pages, and see our current prime rate tracker for the short-end picture.
If you are within 45 days of closing on a mortgage, treat a sub-5% 10-year as a window rather than a trend. One session does not establish direction, and next week’s Fed decision on October 28 can reverse it in an afternoon. Ask your lender what a float-down costs in basis points, get the quote in writing, and compare it against locking today. If you are more than 60 days out, there is no advantage in reacting to a single day’s move at all.
Frequently Asked Questions
What is the 10-year Treasury yield right now?
The 10-year Treasury yield closed at 4.96% on October 22, 2026, according to Treasury’s daily par yield curve. That is down 17 basis points from 5.13% the previous session and the first close below 5% since September 22, 2026. The benchmark had held at or above 5% for 20 consecutive sessions before Thursday.
Why did Treasury yields fall so sharply on October 22?
Investors moved money out of technology and artificial-intelligence shares and into government bonds. The Nasdaq Composite fell 2.60% and the S&P 500 fell 1.21% that session, while Treasury prices rose and yields fell 13 to 17 basis points from the two-year out to the 30-year. Weekly jobless claims were better than expected, so the rally was not a response to weak employment data. Bills were largely unaffected, the signature of an equity rotation rather than a shift in expectations for the Fed’s next move.
Will mortgage rates go down because the 10-year yield fell?
Possibly, with a lag. Thirty-year fixed mortgage rates follow the 10-year Treasury yield plus a spread that lenders adjust for their own costs and risk. Freddie Mac’s survey released October 22 put the 30-year fixed at 7.32%, but that data was collected before the rally. If the 10-year stays below 5% for several sessions, quoted rates generally follow within one to two weeks. A single day’s move rarely shows up in lender sheets, and the spread can widen enough to absorb a small decline in Treasury yields entirely.
Did the prime rate change when Treasury yields dropped?
No. The bank prime loan rate held at 7.00% in the Federal Reserve’s H.15 release of October 22, 2026, unchanged across the five most recent business days. Prime moves only when the Federal Open Market Committee changes its target for the federal funds rate, which stood at an effective 3.88%. Treasury yields are set by bond market trading and have no mechanical link to prime, so variable-rate credit cards, home equity lines of credit and prime-indexed business loans were unaffected by Thursday’s session.
What does a 2.367% real yield on five-year TIPS mean?
It means a buyer at Thursday’s auction earns 2.367% a year above whatever consumer price inflation turns out to be over the next five years, since the principal adjusts with the index. That is the highest real yield at a five-year TIPS auction since October 2023, and a full percentage point above the 1.367% that Treasury’s April 2026 five-year TIPS cleared at. For a saver comparing a nominal five-year CD against TIPS, the breakeven is the five-year implied inflation rate of 2.45%: nominal wins if inflation runs below that, TIPS wins if it runs above.
What will the Fed do at the October 28 meeting?
The Federal Open Market Committee meets October 27 and 28, and the decision arrives on the second afternoon. The Committee is in its communications blackout, so no official guidance is coming before then. Futures pricing on Thursday implied roughly a 22% chance the Fed is finished raising rates this year, leaving another increase as the market’s base case before December. With consumer prices up 3.7% year over year in September, inflation is still the binding constraint. Our Fed rate forecast tracks the pricing daily.
Watching the October 28 Fed Decision
Three things will show whether Thursday was a turn or a blip. First, whether the 10-year can hold below 5% through the Fed decision on October 28. Second, whether the five-year breakeven keeps drifting up, which would mean the rally is about growth rather than inflation. Third, whether next week’s seven-year note and bill auctions draw the same end-investor demand the TIPS sale did. Follow the daily prints on our Treasury yield curve page, the policy calendar on our Fed meeting schedule, and the pass-through to borrowing costs in how the Fed affects loans.
References
- U.S. Department of the Treasury. “Daily Treasury Par Yield Curve Rates,” October 22, 2026. home.treasury.gov
- U.S. Department of the Treasury. “Daily Treasury Par Real Yield Curve Rates,” October 22, 2026. home.treasury.gov
- TreasuryDirect. “Auction Results: 5-Year TIPS, CUSIP 91282CRR4,” October 22, 2026. treasurydirect.gov
- Board of Governors of the Federal Reserve System. “H.15 Selected Interest Rates,” released October 22, 2026. federalreserve.gov
- Board of Governors of the Federal Reserve System. “FOMC Meeting Calendars,” 2026. federalreserve.gov
- Federal Reserve Bank of St. Louis. “5-Year Breakeven Inflation Rate (T5YIE) and related series,” October 22, 2026. fred.stlouisfed.org
- U.S. Bureau of Labor Statistics. “Consumer Price Index for All Urban Consumers,” September 2026. bls.gov
- U.S. Treasury Fiscal Data. “Debt to the Penny,” October 21, 2026. fiscaldata.treasury.gov